Feature Announcements

Subscribe
AlexTing
384 Views

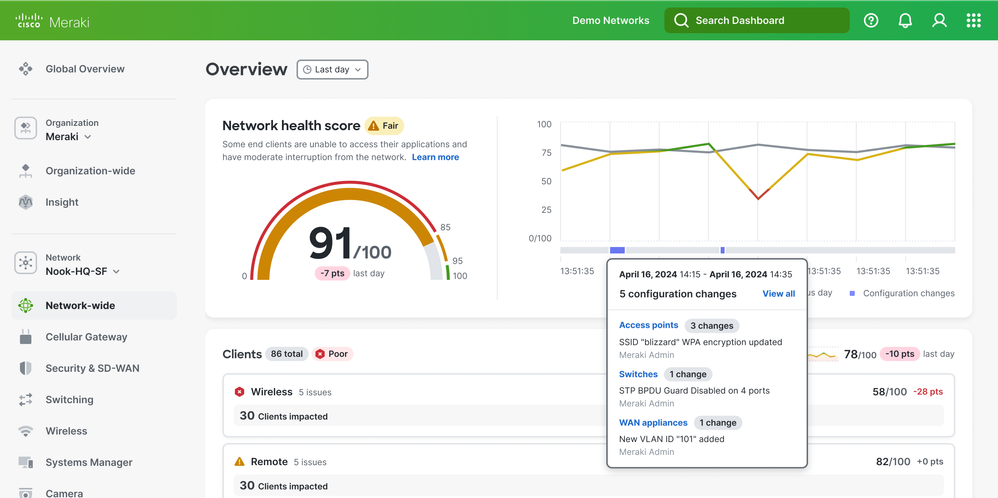
We are excited to share that the new Assurance Overview is now available to everyone via the Early Access page! Assurance Overview provides a unified assurance experience for you to understand the overall health of your network across the entire stack. You can easily monitor your network health and quickly troubleshoot problematic areas.


Enable the feature for your organization by going to Organization > Early Access and opt in to the ‘Assurance Overview’ feature.


Read more...

GeorgeMokdessi
1092 Views

As we reach the first big milestone in our journey to build a better experience for alert management, we are excited to share multiple features we have launched to date.  


At the beginning of February, we made the Organization Alerts page generally available. This page is one of the most requested alerting features by users and an extension of the Alert Hub. It can be found under the Organization tab:


GeorgeMokdessi_1-1722462633545.gif


Read more...

Dibakar
2020 Views

We are excited to announce a new smart alert - MAC flap anomaly. Sometimes, MAC flap detection events can become noisy due to wireless roaming, which is expected. Due to this noise, it is hard to tell which events are expected versus unexpected. To solve this problem, Cisco Meraki has built this smart alert to help detect these unexpected events more accurately.


Read more...

Dibakar
1289 Views

We are thrilled to announce a new email alert functionality ~ mute wireless notification based on switch port schedule. This benefits network administrators who enabled or would like to enable the switch port schedule feature to power off Meraki APs to save energy and do not wish to get notified for AP up and down alerts.

Read more...

Jason_Crawford
1655 Views

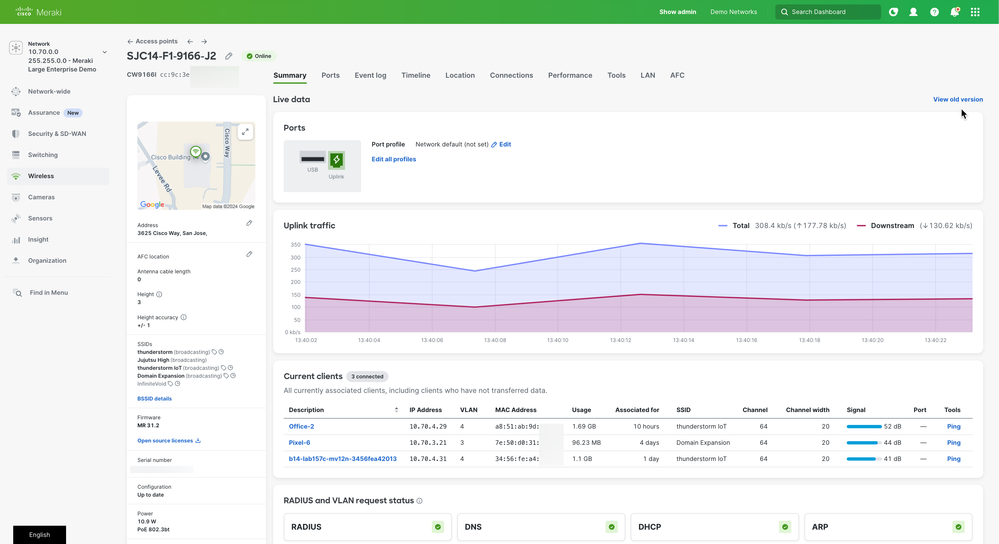
Meraki is launching an all new dashboard experience focused on simplicity and intelligence. The new dashboard is cleaner in design, more intuitive to use, and makes it even easier to see what’s happening within networks. We’re doing this to help customers accomplish more in less time while also making it easier for them to stay on top of all aspects of their networks.


Read more...

GeorgeMokdessi
3250 Views

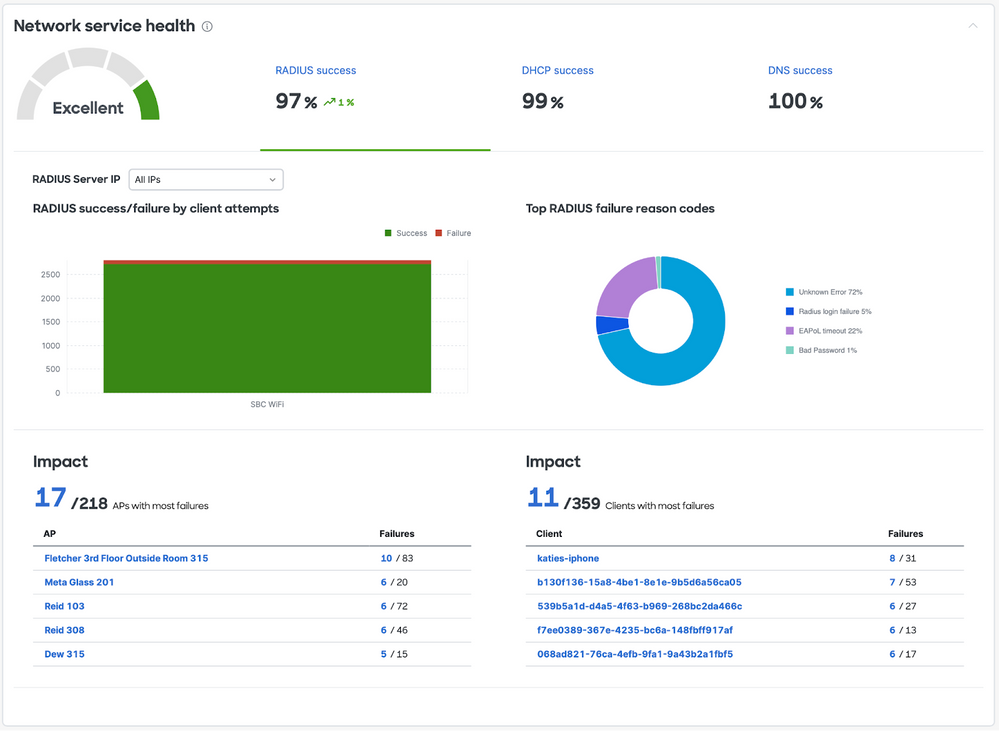
The Meraki dashboard team is super excited to announce the public beta launch of not one, but two brand new features today! The Network Service Health and Roaming Analytics features are both available today (03/31/23) via early access and promise to provide even more powerful and intuitive network assurance management capabilities to you, our customers.


Network Service Health


The Network Service Health tile is designed to allow you a one-stop-shop overview of your entire network environment, greatly reducing the lift of assessing network health and granting a quick monitoring and troubleshooting process.


GeorgeMokdessi_1-1680286400445.png


Read more...

GeorgeMokdessi
2049 Views

We are super excited to announce the launch of the new Switching Overview feature as part of our continuously improving Meraki dashboard! This new feature provides a centralized management hub that gives you a comprehensive view of the status and performance of your switch infrastructure, allowing for better network understanding and identification of potential issues.


Some of the benefits of the new Switching Overview feature include: 


  • Enhanced monitoring experience: The new feature is designed to consolidate wide-ranging alerts, metrics, and overall switch infrastructure health into a condensed bird’s eye view.
  • Reduced click-time: You no longer need to browse through an assortment of dashboard pages. View and monitor your switching network with efficiency and speed.
  • Ability to forecast future network needs: Understand your switching network’s capacity and current utilization to better predict and plan for network expansion needs.
Read more...

GeorgeMokdessi
25015 Views

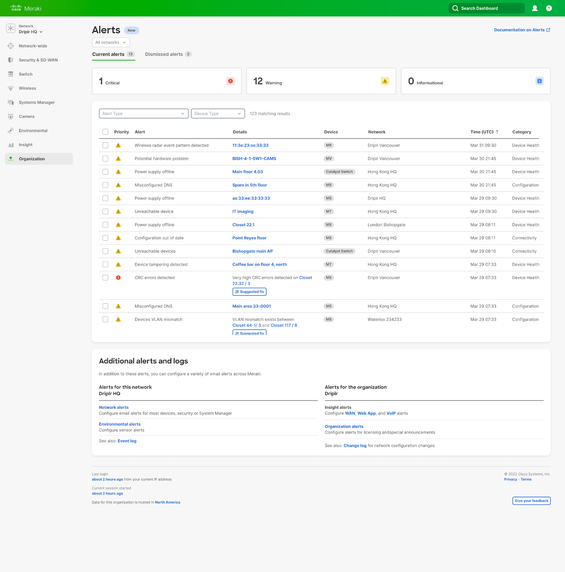
We are excited to announce the release of our new Meraki Health Organization Alerts page, available today (1/26/23) via early access! This much requested feature results in an incredible efficiency boost, reducing click-time and greatly increasing org-wide visibility.


What does it do? 


The new Org Alerts page aims to:


  • Promote Efficiency -  centralizing all dashboard alerts of your organization in a single pane
  • Save time - filter and sort alerts to quickly identify critical issues
  • Increase ease of use - simplified navigation and improved UI allows you to dismiss irrelevant alerts and reduce excess noise


GeorgeMokdessi_0-1674762057183.png

New Organization Alerts Page


How do I enable this?


In the dashboard, navigate to Organization > Early Access. Opt-in by clicking the toggle button for New Organization Alert Page & Alert hub Enhancements.


GeorgeMokdessi_1-1674762056974.png


How do I access the page? 

Once enabled via early access you can access the page by navigating to Organization >> Alerts. 


Additional information on this feature can be found in Meraki Documentation


Angelo_Gouvis
4140 Views

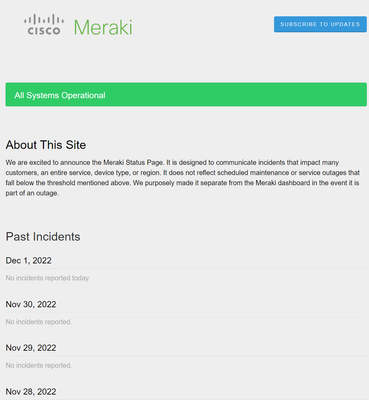
We are excited to announce the Meraki Status Page. It is designed to communicate incidents that impact many customers, an entire service, device type, or region. It does not reflect scheduled maintenance or service outages that fall below a certain threshold.


We purposely made it separate from the Meraki Dashboard in the event it is part of an outage. No login is required to access the Meraki Status Page: https://status.meraki.net


Angelo_Gouvis_0-1670863623028.png


Please be aware that outages that are not systemic in nature, or don’t affect a significant percentage of Meraki customers may not be reflected on the Meraki Status Page.  This is intentional to keep the “noise level” down, and only call out truly impactful outages.

To learn more about the Meraki Status page, including how to subscribe to notifications, please visit our Meraki Status Page documentation page.

  • Meraki Health
CameronMoody
2298 Views

This Meraki dashboard feature is designed to reduce time to resolution for our customers by easing manual tasks, simplifying the configuration process, and dynamically detecting errors.


Read more...

Dibakar
2990 Views

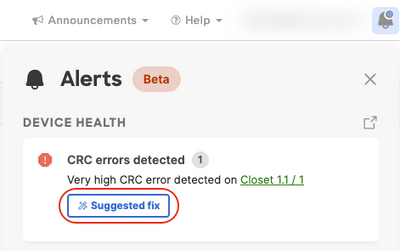
What is the guided CRC troubleshooting flow?
 
This feature will provide users with clear and easy-to-follow step-by-step instructions to help resolve CRC errors. An administrator should see this feature in the alert hub once available and if CRC errors exist in the network.
 
CRC Alert.png
Read more...

Email Updates

Subscribe here if you would like to receive the latest news and announcements from Meraki — just click on the Subscribe button above.

To filter to see a particular kind of update, click the Labels below.

By selecting labels, you can also subscribe to only updates matching the chosen label(s).

Subscribe
Get the latest updates from the Feature Announcements blog delivered to your email inbox.