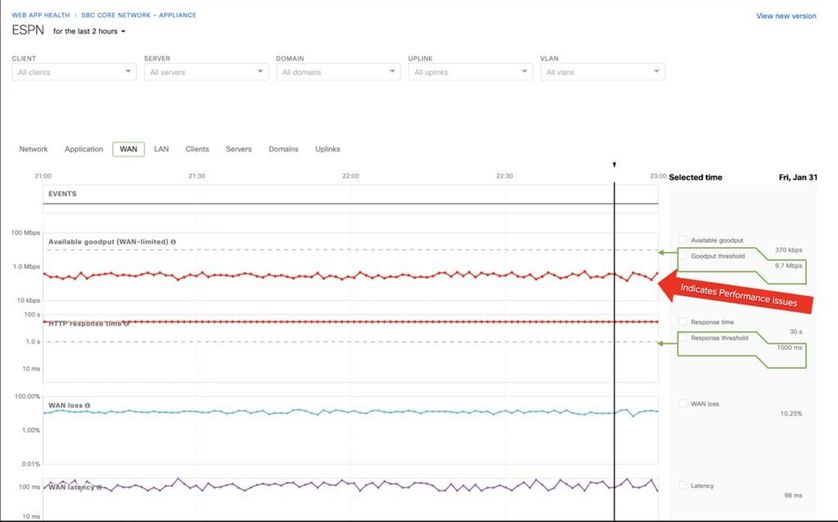
The troubleshooting page under "Web App Health" on Insight has some updated UI changes as follows:

1. Goodput and Response Time Threshold values are now displayed on the right hand side as a part of the graph legend.
2. When Goodput or Response Time crosses the threshold line, its marked as RED to clearly point out times/durations of possible performance issues.