We're migrating to the Cisco Community on March 29. The Meraki Community will enter read-only mode starting on March 26.
Learn more- Feature Announcements
- :
- New Network Service Health and Roaming Analytics Features!
New Network Service Health and Roaming Analytics Features!
The Meraki dashboard team is super excited to announce the public beta launch of not one, but two brand new features today! The Network Service Health and Roaming Analytics features are both available today (03/31/23) via early access and promise to provide even more powerful and intuitive network assurance management capabilities to you, our customers.
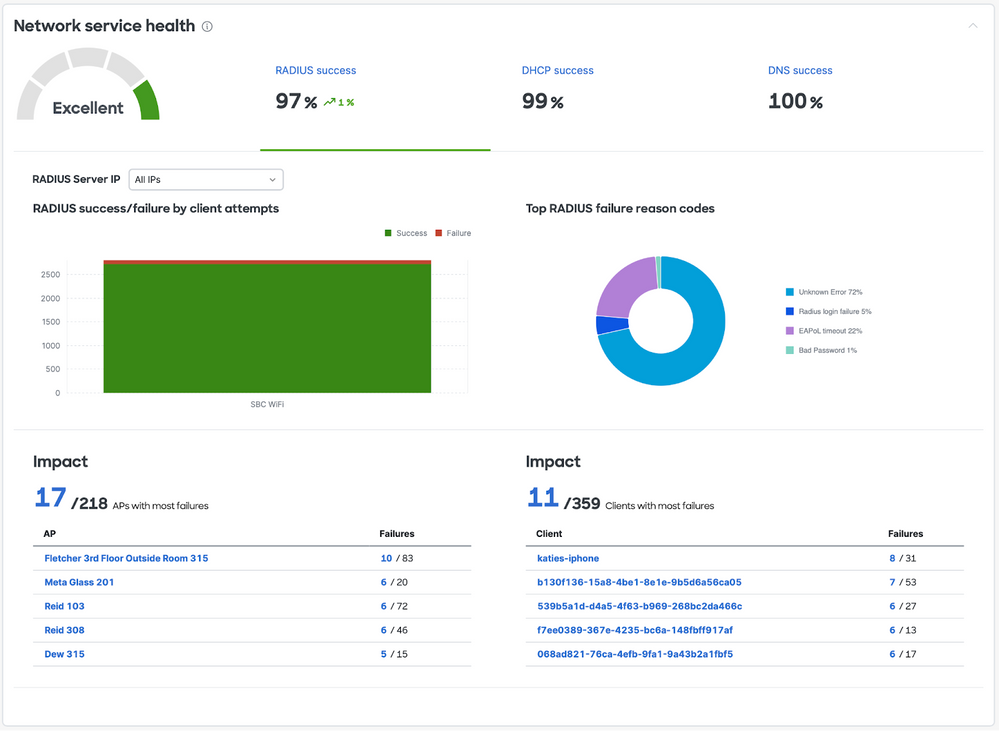
Network Service Health
The Network Service Health tile is designed to allow you a one-stop-shop overview of your entire network environment, greatly reducing the lift of assessing network health and granting a quick monitoring and troubleshooting process.
With Network Service Health you will be able to get a comprehensive overview of all Radius, DHCP, and DNS server environments as well as a more detailed metric view. Assess overall performance with ease, while also diving deeper into specified client attempts or potential server failure reason codes.
Roaming Analytics
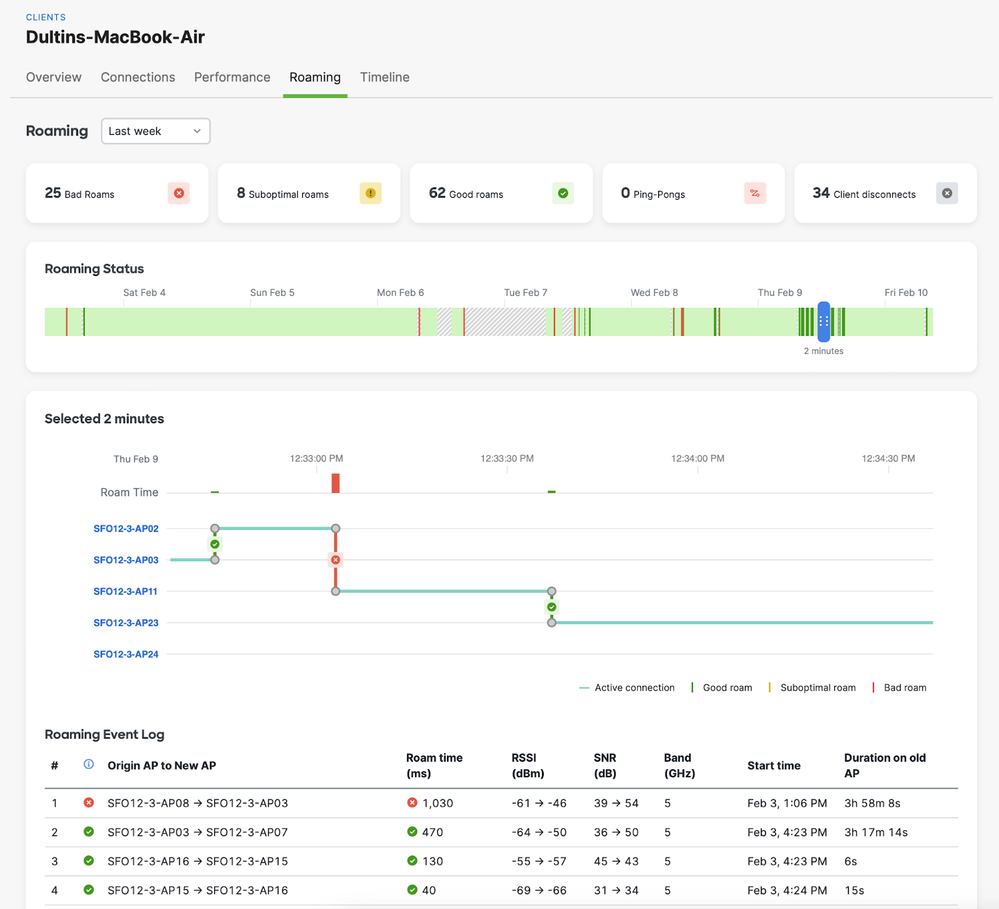
We understand the pain points associated with the standard process monitoring client roaming activity. The old process can be tedious and intensely manual, but with our new Roaming Analytics feature we transform the old static log of network events into an interactive and engaging dashboard view:
Roaming Analytics was built to provide a streamlined visualization of roaming behavior; relaying crucial roaming metrics such as client disconnects and roaming success rate. Additionally, it provides a time range selector tool you can use to pinpoint specific time periods or hone in on specific client activity.
How do I access these cool new features?
Find both of these new features in our Meraki dashboard Early Access program. First navigate to Organization > Early Access and opt-in by clicking the toggle buttons seen below:
Learn more about both Network Service Health and Roaming Analytics in their respective Meraki documentation pages. Thanks for trying these new features out!
-
AI Assistant
3 -
API & Webhooks
27 -
Beta
38 -
Breaking changes
11 -
Catalyst
28 -
Cisco Secure Connect
2 -
Features
227 -
Firmware
44 -
Meraki Health
25 -
MG Wireless WAN
10 -
MI Insight
17 -
Mobile App
9 -
MR Wireless
66 -
MS Switch
61 -
MT Sensors
29 -
MV Cameras
49 -
MX Security & SD-WAN
48 -
Products
95 -
SASE
3 -
SM Endpoint Management
35
- « Previous
- Next »


