Get answers from our community of experts in record time.
Join now- Technical Forums
- :
- Dashboard & Administration
- :
- Re: Major Outage
Major Outage
Solved- Subscribe to RSS Feed
- Mark Topic as New
- Mark Topic as Read
- Float this Topic for Current User
- Bookmark
- Subscribe
- Mute
- Printer Friendly Page
- Mark as New
- Bookmark
- Subscribe
- Mute
- Subscribe to RSS Feed
- Permalink
- Report Inappropriate Content
Major Outage
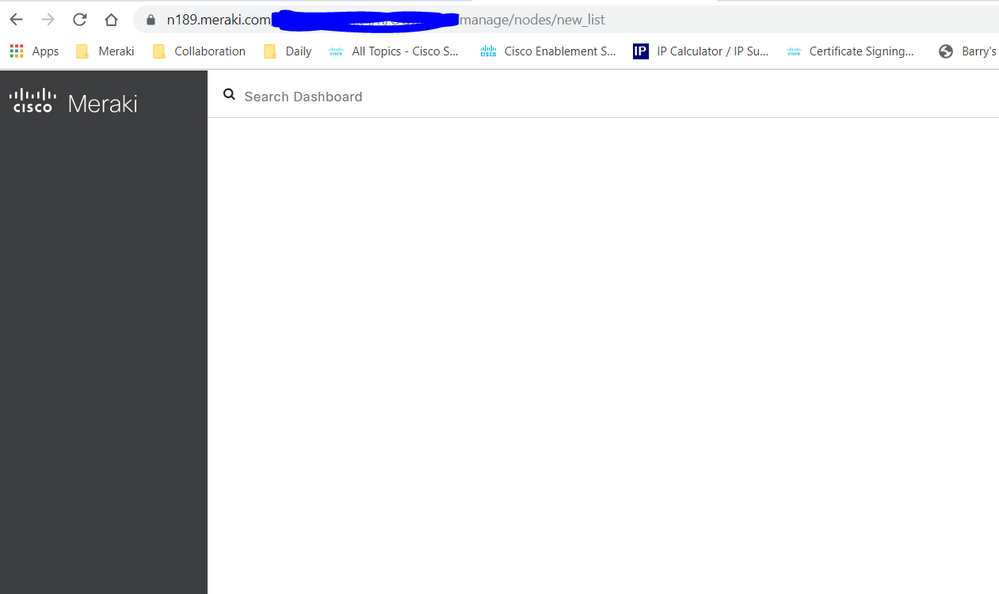
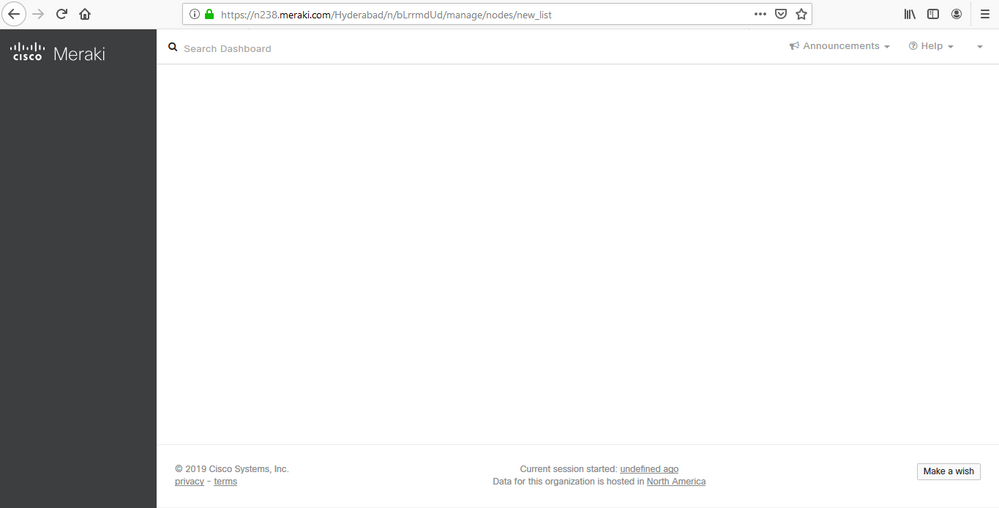
I am seeing across many shards an outage in the dashboard functionality. We can't bring up clients or their networks or see their devices.
I have contacted support and they have confirmed there is an issue.
Solved! Go to solution.
- Mark as New
- Bookmark
- Subscribe
- Mute
- Subscribe to RSS Feed
- Permalink
- Report Inappropriate Content
After an internal investigation, Cisco Meraki has found the source of the problem which caused an outage of the Meraki dashboard between 9pm and 10:30pm PDT on 8/12. We found that errors in the integration process for dashboard resulted in frontend code being deployed which was no longer compatible with the dashboard application and backend. This issue was resolved and the processes that allowed this issue are currently being improved to prevent problems like this in the future.
Alex S | Cisco Meraki Product Management - Cloud
- Mark as New
- Bookmark
- Subscribe
- Mute
- Subscribe to RSS Feed
- Permalink
- Report Inappropriate Content
I was part way through a site wide switch firmware upgrade. The whole site has been taken out, and the firmware upgrades have stopped. Some stack members completed the download, some didn't.
Worst possible timing.
- Mark as New
- Bookmark
- Subscribe
- Mute
- Subscribe to RSS Feed
- Permalink
- Report Inappropriate Content
Did your upgrade take out the dashboard for all of us? 😃
- Mark as New
- Bookmark
- Subscribe
- Mute
- Subscribe to RSS Feed
- Permalink
- Report Inappropriate Content
- Mark as New
- Bookmark
- Subscribe
- Mute
- Subscribe to RSS Feed
- Permalink
- Report Inappropriate Content
Same here..
- Mark as New
- Bookmark
- Subscribe
- Mute
- Subscribe to RSS Feed
- Permalink
- Report Inappropriate Content
Seeing the same issue in Chicago.
- Mark as New
- Bookmark
- Subscribe
- Mute
- Subscribe to RSS Feed
- Permalink
- Report Inappropriate Content
Same here @PhilipDAth . I am in the middle of LDAP integration.
Ajit
AjitsNW@gmail.com
www.ajit.network
- Mark as New
- Bookmark
- Subscribe
- Mute
- Subscribe to RSS Feed
- Permalink
- Report Inappropriate Content
Confirmed here is Australia as well.
If it makes you feel any better @PhilipDAth , we were part way commissioning a new site with 50+ cameras, 15+ APs and switches.
We have stopped now until this is resolved.
- Mark as New
- Bookmark
- Subscribe
- Mute
- Subscribe to RSS Feed
- Permalink
- Report Inappropriate Content
>If it makes you feel any better
Nope. 😞
- Mark as New
- Bookmark
- Subscribe
- Mute
- Subscribe to RSS Feed
- Permalink
- Report Inappropriate Content
This is obviously a serious global outage affecting either the majority or all shards.
- Mark as New
- Bookmark
- Subscribe
- Mute
- Subscribe to RSS Feed
- Permalink
- Report Inappropriate Content
Lets flip this around - anyone in the world still have their dashboard working?
- Mark as New
- Bookmark
- Subscribe
- Mute
- Subscribe to RSS Feed
- Permalink
- Report Inappropriate Content
Yeah ours died too. Funny thing was a team mate was doing his very first Meraki device and of course it died whilst he touched it. So we blamed him for breaking it 😄
- Mark as New
- Bookmark
- Subscribe
- Mute
- Subscribe to RSS Feed
- Permalink
- Report Inappropriate Content
nope. our's is not working either.
- Mark as New
- Bookmark
- Subscribe
- Mute
- Subscribe to RSS Feed
- Permalink
- Report Inappropriate Content
Makes me feel safe and secure.
- Mark as New
- Bookmark
- Subscribe
- Mute
- Subscribe to RSS Feed
- Permalink
- Report Inappropriate Content
This is actually a security enhancement.
- Mark as New
- Bookmark
- Subscribe
- Mute
- Subscribe to RSS Feed
- Permalink
- Report Inappropriate Content
We are back online.
- Mark as New
- Bookmark
- Subscribe
- Mute
- Subscribe to RSS Feed
- Permalink
- Report Inappropriate Content
Yup us too.
- Mark as New
- Bookmark
- Subscribe
- Mute
- Subscribe to RSS Feed
- Permalink
- Report Inappropriate Content
Everything looks happy to me as well now.
- Mark as New
- Bookmark
- Subscribe
- Mute
- Subscribe to RSS Feed
- Permalink
- Report Inappropriate Content
Everything up and running (again)
- Mark as New
- Bookmark
- Subscribe
- Mute
- Subscribe to RSS Feed
- Permalink
- Report Inappropriate Content
@MeredithW @CarolineS Do you know something about it or can tell us who could tell us about, what the problem was?
Seemed like a bigger problem O_o Interessting
- Mark as New
- Bookmark
- Subscribe
- Mute
- Subscribe to RSS Feed
- Permalink
- Report Inappropriate Content
dashboard is up and running again.
But we don't see the number of networks on the map. Usually we have there some big (mostly) green bubbles showing the number of regional networks.
This is missing, since the management services are up again.
Anybody else seeing this behaviour, too?
- Mark as New
- Bookmark
- Subscribe
- Mute
- Subscribe to RSS Feed
- Permalink
- Report Inappropriate Content
@Axel_R wrote:dashboard is up and running again.
But we don't see the number of networks on the map. Usually we have there some big (mostly) green bubbles showing the number of regional networks.
This is missing, since the management services are up again.
Anybody else seeing this behaviour, too?
Yes, confirmed.
- Mark as New
- Bookmark
- Subscribe
- Mute
- Subscribe to RSS Feed
- Permalink
- Report Inappropriate Content
Same chatter on Reddit.
Users on reddit report that, it could look like Meraki outage happened at the same time as a Level3 outage. Meraki might use Level3 somewhere.
Like what you see? - Give a Kudo ## Did it answer your question? - Mark it as a Solution 🙂
All code examples are provided as is. Responsibility for Code execution lies solely your own.
- Mark as New
- Bookmark
- Subscribe
- Mute
- Subscribe to RSS Feed
- Permalink
- Report Inappropriate Content
@rhbirkelund wrote:Same chatter on Reddit.
Users on reddit report that, it could look like Meraki outage happened at the same time as a Level3 outage. Meraki might use Level3 somewhere.
Outage this morning?
Anyone else get notified that their AP's went down/up this morning? Ours self-reported an outage from 7:00-7:35 A.M. EDT.
- Mark as New
- Bookmark
- Subscribe
- Mute
- Subscribe to RSS Feed
- Permalink
- Report Inappropriate Content
@MarcP wrote:
@rhbirkelund wrote:Same chatter on Reddit.
Users on reddit report that, it could look like Meraki outage happened at the same time as a Level3 outage. Meraki might use Level3 somewhere.
You mean this post, 2 Years ago? 😉27Outage this morning?
Anyone else get notified that their AP's went down/up this morning? Ours self-reported an outage from 7:00-7:35 A.M. EDT.
Meh...
*mumbles something about more coffee...*
Like what you see? - Give a Kudo ## Did it answer your question? - Mark it as a Solution 🙂
All code examples are provided as is. Responsibility for Code execution lies solely your own.
- Mark as New
- Bookmark
- Subscribe
- Mute
- Subscribe to RSS Feed
- Permalink
- Report Inappropriate Content
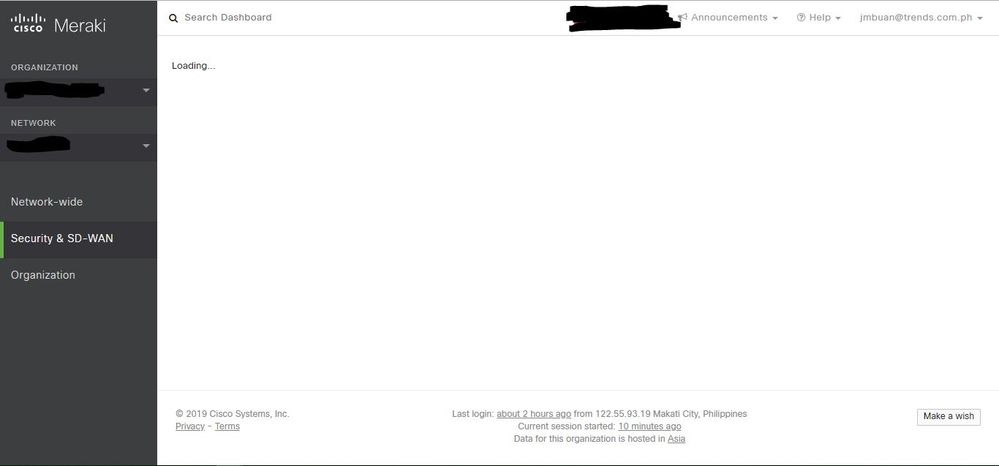
Can anyone confirm that the Threat Protection in Security & SD WAN is not working? The page is just loading.
- Mark as New
- Bookmark
- Subscribe
- Mute
- Subscribe to RSS Feed
- Permalink
- Report Inappropriate Content
- Mark as New
- Bookmark
- Subscribe
- Mute
- Subscribe to RSS Feed
- Permalink
- Report Inappropriate Content
confirmed in UK - just posted another thread about this problem.
Also, the Site/Network location markers are missing from the Overview map too 😞
- Mark as New
- Bookmark
- Subscribe
- Mute
- Subscribe to RSS Feed
- Permalink
- Report Inappropriate Content
Case is open with Meraki
- Mark as New
- Bookmark
- Subscribe
- Mute
- Subscribe to RSS Feed
- Permalink
- Report Inappropriate Content
As all seems to be fine again, does anyone know what caused the problems?
- Mark as New
- Bookmark
- Subscribe
- Mute
- Subscribe to RSS Feed
- Permalink
- Report Inappropriate Content
The Meraki cloud engineering and PM team are still investigating this issue. We believe this is resolved now but are still digging into the root cause. I will update this thread later when we have more information.
Alex S | Cisco Meraki Product Management - Cloud
- Mark as New
- Bookmark
- Subscribe
- Mute
- Subscribe to RSS Feed
- Permalink
- Report Inappropriate Content
After an internal investigation, Cisco Meraki has found the source of the problem which caused an outage of the Meraki dashboard between 9pm and 10:30pm PDT on 8/12. We found that errors in the integration process for dashboard resulted in frontend code being deployed which was no longer compatible with the dashboard application and backend. This issue was resolved and the processes that allowed this issue are currently being improved to prevent problems like this in the future.
Alex S | Cisco Meraki Product Management - Cloud
- Mark as New
- Bookmark
- Subscribe
- Mute
- Subscribe to RSS Feed
- Permalink
- Report Inappropriate Content
Is there some kind of independent Meraki status page to get info on outages like this?
- Mark as New
- Bookmark
- Subscribe
- Mute
- Subscribe to RSS Feed
- Permalink
- Report Inappropriate Content
That would be a great idea!
- Mark as New
- Bookmark
- Subscribe
- Mute
- Subscribe to RSS Feed
- Permalink
- Report Inappropriate Content
What about monitoring with statuspage.io for example?
- Mark as New
- Bookmark
- Subscribe
- Mute
- Subscribe to RSS Feed
- Permalink
- Report Inappropriate Content
En México tuvimos la misma afectación se escalo con el soporte de Cisco Meraki y nos comentan lo siguiente.
Saludos,
Gracias por contactar soporte Cisco Meraki!
El problema de visibilidad al portal de Dashboard se debió a problemas en nuestro backend registrados en el día de ayer alrededor de las 21:50 PDT. El problema fue rectificado y los servicios re-establecidos nuevamente.
Favor de notar que durante esta eventualidad los equipos no perdieron funcionalidad, solo el acceso a la plataforma de configuración estaba fuera de servicio.
Si tienes alguna pregunta al respecto no dudes en contactarnos.
- Mark as New
- Bookmark
- Subscribe
- Mute
- Subscribe to RSS Feed
- Permalink
- Report Inappropriate Content
Sounds like yesterday was a good excercise in maintenance mangement for everyone. Hope you all had good plans in place 😛
-
Administrators
239 -
Change log
15 -
Firmware upgrades
31 -
Inventory
48 -
Licensing
80 -
Meraki mobile app
12 -
Other
177


