We're migrating to the Cisco Community on March 29. The Meraki Community will enter read-only mode starting on March 26.
Learn more- Technical Forums
- :
- Security & SD-WAN
- :
- Overload Meraki ?
Overload Meraki ?
- Subscribe to RSS Feed
- Mark Topic as New
- Mark Topic as Read
- Float this Topic for Current User
- Bookmark
- Subscribe
- Mute
- Printer Friendly Page
- Mark as New
- Bookmark
- Subscribe
- Mute
- Subscribe to RSS Feed
- Permalink
- Report Inappropriate Content
Overload Meraki ?
Hi, first time using MX and so far the experience is very good. Right now we're using MX67 as our gateway, a few days ago we experience network outage several times during live conference and trying to find out why the outage occured. I've checked on the ISP NMS and can confirm their network doesn't have problem.
Some question here :
- how does meraki treat client size limit (MX67 is recommended to use for network 50 clients and below - but we're pushing this by using it on network with 100 clients as our uplink only 2x20Mbps).
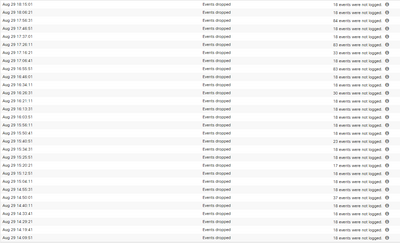
- Every time the network outage occurred we notice on Meraki log there's several "Events dropped" log, does this mean our MX is overload (still the bandwidth utilization is low - about 15Mbps only and the uplink monitoring on meraki to 8.8.8.8 is working fine) ?
- On summary report, at the time network outage occurred the MX CPU utilization is very low - 10-40% only
I suspect this happened because Meraki have packet overload from 100 clients, but still confused why the utilization is low.
- Mark as New
- Bookmark
- Subscribe
- Mute
- Subscribe to RSS Feed
- Permalink
- Report Inappropriate Content
Hi @and12345
https://documentation.meraki.com/MX/Monitoring_and_Reporting/Device_Utilization
Have you checked out the device utilisation stats on the MX.
Never purposely overloaded an MX so not sure on what behaviour you would see or expect. One would assume it may grind to a halt...!
https://www.linkedin.com/in/darrenoconnor/
I'm not an employee of Cisco/Meraki. My posts are based on Meraki best practice and what has worked for me in the field.
- Mark as New
- Bookmark
- Subscribe
- Mute
- Subscribe to RSS Feed
- Permalink
- Report Inappropriate Content
Hi, the utilization is low, but we got a lot of event dropped on the event log
- Mark as New
- Bookmark
- Subscribe
- Mute
- Subscribe to RSS Feed
- Permalink
- Report Inappropriate Content
@and12345 can you send the events to a syslog server where hopefully we can see why there are so many events and why they are being dropped?
I seem to remember there can be a storage issue on the small MXs, might be worth getting support to take a look at that.
- Mark as New
- Bookmark
- Subscribe
- Mute
- Subscribe to RSS Feed
- Permalink
- Report Inappropriate Content
@and12345 if you ask the support team they can see more metrics, having more clients connected than recommend doesn't automatically cause issues, we often have 100+ going through MX64/5/7 for the public internet connection at our venues but they are running the enterprise software with little in the way of policies and many of the clients are smartphones only doing occasional background checks. However our MX tend to sit at about 5-10% CPU load...
- Mark as New
- Bookmark
- Subscribe
- Mute
- Subscribe to RSS Feed
- Permalink
- Report Inappropriate Content
Couple of things I'd check in SD-WAN\Config\Traffic Shaping: 1) don't set the WAN uplink limits to exactly match your service; leave some buffer. 2) same location Traffic Shaping Rules enable the default rules; they help greatly prioritizing traffic. This same setting can be set if you're using Meraki WiFi as well.
- Mark as New
- Bookmark
- Subscribe
- Mute
- Subscribe to RSS Feed
- Permalink
- Report Inappropriate Content
Opening ticket to the support and they confirm the cause of network down is because MX overload, the event dropped log is because of spike of traffic that not getting logged on MX utilization. Maybe its time to look for bigger firewall.
-
3rd Party VPN
174 -
ACLs
91 -
Auto VPN
305 -
AWS
36 -
Azure
70 -
Client VPN
382 -
Firewall
866 -
iOS
1 -
Other
556 -
Wireless LAN MR
1


