Get answers from our community of experts in record time.
Join now- Technical Forums
- :
- Security & SD-WAN
- :
- MX67 on 15.33-35, summary page shows 100% utilization
MX67 on 15.33-35, summary page shows 100% utilization
Solved- Subscribe to RSS Feed
- Mark Topic as New
- Mark Topic as Read
- Float this Topic for Current User
- Bookmark
- Subscribe
- Mute
- Printer Friendly Page
- Mark as New
- Bookmark
- Subscribe
- Mute
- Subscribe to RSS Feed
- Permalink
- Report Inappropriate Content
MX67 on 15.33-35, summary page shows 100% utilization
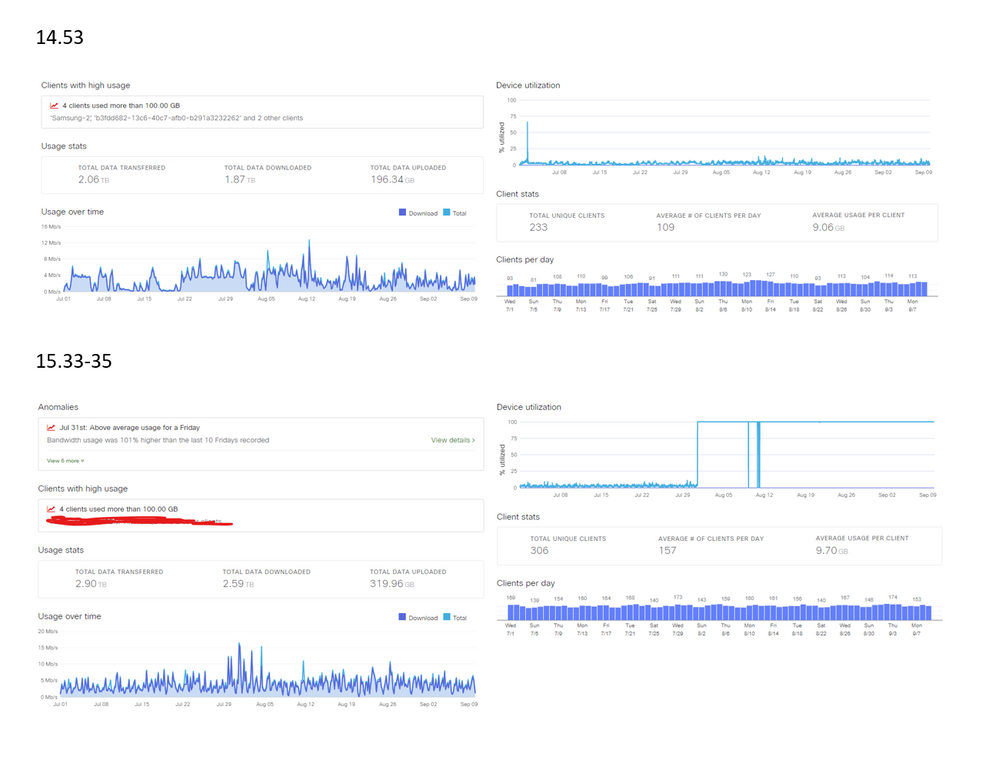
I have about 15 MX67s currently on 15.35, and all of them show on the summary page at 100% utilization constantly. A few of them were on a 14.x firmware previously and as you can see, the utilization became pegged at 100% when going from 14.x to 15.33 on July 31st. No improvement to the issue on 15.34 or 15.35.
Support claims this is not happening elsewhere, and is trying to say that my client count is too high, wants me to disable features, etc. At first they said it was not really at 100%, then came back and said it was.
Is this happening to anyone else out there? I'd like to know if I need to escalate this to my SE or if I should just downgrade and hope they fix it at some point.
Solved! Go to solution.
- Mark as New
- Bookmark
- Subscribe
- Mute
- Subscribe to RSS Feed
- Permalink
- Report Inappropriate Content
For anyone curious, I spent a few hours troubleshooting over the weekend. I wrote a long post on my troubleshooting process that failed due to timeout, so this is the short version.
Basically, I had a VPN firewall rule set to allow syslog traffic with everything else denied from many of my branches, as they don't need to access anything and its just for administration. But I stupidly set that to enable logging, so every time a flow message was sent, that then created another firewall allow message, and so on. This for some reason only affected the ones that had been on 15.x, but once I narrowed down the VPN as the source of the issue, I just had to identify what about the VPN was the issue. Once I turned off the logging, utilization went down to less than 10% after a couple hours, Yay!
So, moral of the story is, don't enable logging on VPN firewall rules for allowing syslog traffic.
- Mark as New
- Bookmark
- Subscribe
- Mute
- Subscribe to RSS Feed
- Permalink
- Report Inappropriate Content
If not service affecting why not downgrade and verify the behaviour. Whilst pegging at 100% are you experiencing any adverse behaviour?
https://www.linkedin.com/in/darrenoconnor/
I'm not an employee of Cisco/Meraki. My posts are based on Meraki best practice and what has worked for me in the field.
- Mark as New
- Bookmark
- Subscribe
- Mute
- Subscribe to RSS Feed
- Permalink
- Report Inappropriate Content
I planned to downgrade but wanted to know if it was just bad reporting in the summary page, then support asked me not to downgrade so they can troubleshoot and get a differential.
I'm not personally on site at these locations, but haven't had any complaints that the network is super slow. That's why I thought maybe it was a bug in the summary page reporting.
- Mark as New
- Bookmark
- Subscribe
- Mute
- Subscribe to RSS Feed
- Permalink
- Report Inappropriate Content
For anyone curious, I spent a few hours troubleshooting over the weekend. I wrote a long post on my troubleshooting process that failed due to timeout, so this is the short version.
Basically, I had a VPN firewall rule set to allow syslog traffic with everything else denied from many of my branches, as they don't need to access anything and its just for administration. But I stupidly set that to enable logging, so every time a flow message was sent, that then created another firewall allow message, and so on. This for some reason only affected the ones that had been on 15.x, but once I narrowed down the VPN as the source of the issue, I just had to identify what about the VPN was the issue. Once I turned off the logging, utilization went down to less than 10% after a couple hours, Yay!
So, moral of the story is, don't enable logging on VPN firewall rules for allowing syslog traffic.
- Mark as New
- Bookmark
- Subscribe
- Mute
- Subscribe to RSS Feed
- Permalink
- Report Inappropriate Content
So, you were logging your own syslog message over the tunnel... generating an syslog message....
a loop spanningtree can't do anything about 🤣
But nice find 👌
- Mark as New
- Bookmark
- Subscribe
- Mute
- Subscribe to RSS Feed
- Permalink
- Report Inappropriate Content
Do you have a specific reason for running 15 (beta) firmware? Unless you're needing something specific that's only in the beta firmware, running with Stable or Stable RC will likely be more reliable. If there is a particular feature you're trying, it wouldn't be HTTPS Inspection, would it?https://documentation.meraki.com/MX/Content_Filtering_and_Threat_Protection/HTTPS_Inspection
- Mark as New
- Bookmark
- Subscribe
- Mute
- Subscribe to RSS Feed
- Permalink
- Report Inappropriate Content
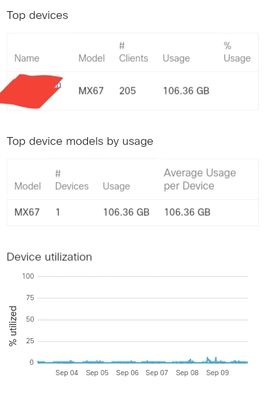
I have an MX67 running 15.33 since it came out and the usage is below:
- Mark as New
- Bookmark
- Subscribe
- Mute
- Subscribe to RSS Feed
- Permalink
- Report Inappropriate Content
OK, that is good to know. Hopefully I don't have a bad batch of MX devices.
Thanks for confirming!
- Mark as New
- Bookmark
- Subscribe
- Mute
- Subscribe to RSS Feed
- Permalink
- Report Inappropriate Content
@GreenMan wrote:Do you have a specific reason for running 15 (beta) firmware? Unless you're needing something specific that's only in the beta firmware, running with Stable or Stable RC will likely be more reliable. If there is a particular feature you're trying, it wouldn't be HTTPS Inspection, would it?https://documentation.meraki.com/MX/Content_Filtering_and_Threat_Protection/HTTPS_Inspection
I too would be curious if you've enabled HTTPS Inspection. That's going to eat all the resources you've got and then some, compared to performance without it enabled.
- Mark as New
- Bookmark
- Subscribe
- Mute
- Subscribe to RSS Feed
- Permalink
- Report Inappropriate Content
Honestly, I only upgraded due to having 3 different MX67 units that bricked when trying to bring up as a new adopted device, and support said that the factory firmware was conflicting with the default version at the time (14.42 at the time I think) when they would first come online. They said I should put all of them on a test network one by one and make them update to 15.x to make sure they wouldn't brick when sent out to the site. Then I wanted to keep them consistent so I upgraded some of the other sites that were on a 14.x version.
I do not have HTTPS inspection turned on, at least that I know of. I've yet to see that exposed in the dashboard.
I'll probably just downgrade to 14.53, but wanted to know if this was more widespread. I have noticed a lot of content filtering blocks lately from DNS over HTTPS (included in proxy avoidance and anonymizers) and wondered if that is part of the issue.
Here is a comparison of two MXs with almost identical setup. The bottom one was upgraded to 15.33 on July 31st and nothing in the config was changed at that time.
- Mark as New
- Bookmark
- Subscribe
- Mute
- Subscribe to RSS Feed
- Permalink
- Report Inappropriate Content
Hi,
I've checked...
I'm running a MX67 with 15.35 at my home(lab) and 3 MX57w's with 15.33 at a customer ( due to vpn issues) and i also don't see this behavior there...
-
3rd Party VPN
166 -
ACLs
90 -
Auto VPN
291 -
AWS
36 -
Azure
67 -
Client VPN
369 -
Firewall
839 -
iOS
1 -
Other
542 -
Wireless LAN MR
1


