We're migrating to the Cisco Community on March 29. The Meraki Community will enter read-only mode starting on March 26.
Learn more- Technical Forums
- :
- Security & SD-WAN
- :
- Re: CPU utilization on your MX!
CPU utilization on your MX!
- Subscribe to RSS Feed
- Mark Topic as New
- Mark Topic as Read
- Float this Topic for Current User
- Bookmark
- Subscribe
- Mute
- Printer Friendly Page
- Mark as New
- Bookmark
- Subscribe
- Mute
- Subscribe to RSS Feed
- Permalink
- Report Inappropriate Content
CPU utilization on your MX!
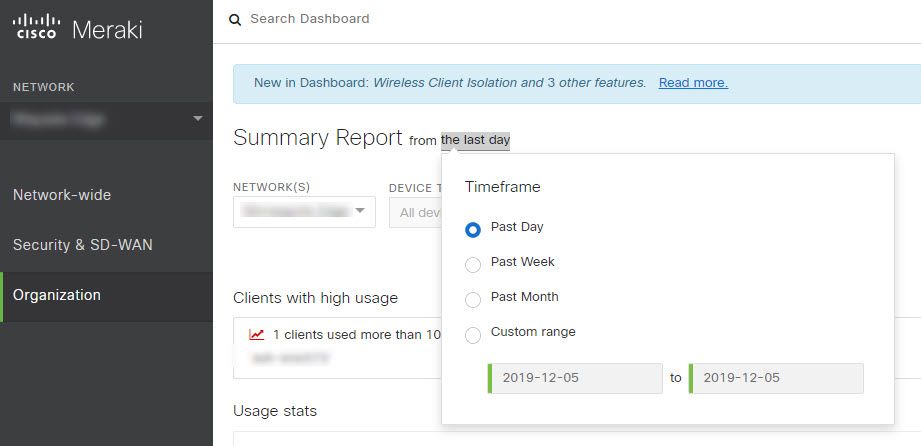
Want to find out how your MX is performing? Make sure you are running our latest beta and find out under Organization -> Summary report and select "View new version".
- Mark as New
- Bookmark
- Subscribe
- Mute
- Subscribe to RSS Feed
- Permalink
- Report Inappropriate Content
I assume the Usage% is the CPU usage? You may want to add the "CPU" bit to the interface, otherwise folk might think it is a different sort of utilisiation (memory?, bandwidth?, time connected?)
Nice to see in there though, as it helps spot heavily used devices.
#swagplease
- Mark as New
- Bookmark
- Subscribe
- Mute
- Subscribe to RSS Feed
- Permalink
- Report Inappropriate Content
+1 for renaming this to "CPU utilisation" - Highly misleading otherwise.
Found this helpful? Give me some Kudos! (click on the little up-arrow below)
- Mark as New
- Bookmark
- Subscribe
- Mute
- Subscribe to RSS Feed
- Permalink
- Report Inappropriate Content
- Mark as New
- Bookmark
- Subscribe
- Mute
- Subscribe to RSS Feed
- Permalink
- Report Inappropriate Content
Good feature, but the graph timing bug is still present. Look at the usage summary versus utilization - it's off by a few hours. I reported this confirmed bug awhile ago via open/closed case.
- Mark as New
- Bookmark
- Subscribe
- Mute
- Subscribe to RSS Feed
- Permalink
- Report Inappropriate Content
Nice feature, I've often wondered if/how I could see this info, was curious about the load on my MXs.
- Mark as New
- Bookmark
- Subscribe
- Mute
- Subscribe to RSS Feed
- Permalink
- Report Inappropriate Content
+1 for renaming this to "CPU utilisation". Any chance of getting a memory utilisation graph too?
- Mark as New
- Bookmark
- Subscribe
- Mute
- Subscribe to RSS Feed
- Permalink
- Report Inappropriate Content
And it looks like the graph timing bug I mentioned above has been resolved too.
- Mark as New
- Bookmark
- Subscribe
- Mute
- Subscribe to RSS Feed
- Permalink
- Report Inappropriate Content
This is great! Will there be real-time reporting in the future?
- Mark as New
- Bookmark
- Subscribe
- Mute
- Subscribe to RSS Feed
- Permalink
- Report Inappropriate Content
Hi,
I know this is an old entry in the community...just wondering I see in the summary report now CPU Usage, but
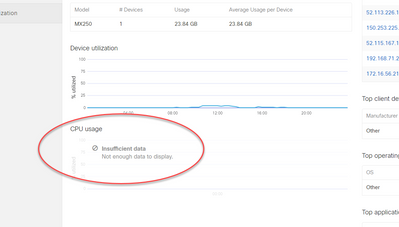
on all my MX's it shows the message insufficient data....is this CPU usage still not there?
Still it would be nice to have this information in real time...I do make a wish.
rgds
roger
- Mark as New
- Bookmark
- Subscribe
- Mute
- Subscribe to RSS Feed
- Permalink
- Report Inappropriate Content
I am not seeing CPU utilization across any orgs today and I am 100% sure I did just about two weeks ago because a customer had an MX80 that was peaking at 100% every day so I upgraded them to a MX100 and have been checking daily for the screen to populate, but it never does. I checked some other orgs with MX's that have been running forbears and the same thing. Has this feature been removed or something?
- Mark as New
- Bookmark
- Subscribe
- Mute
- Subscribe to RSS Feed
- Permalink
- Report Inappropriate Content
Same for me. Under Summary Report for an individual appliance, they all say "Insufficient Data". I put in a case w/ Meraki Support and they said that this is a known issue and they will contact me with any updates or when a fix is implemented.
- Mark as New
- Bookmark
- Subscribe
- Mute
- Subscribe to RSS Feed
- Permalink
- Report Inappropriate Content
intresting...could you post any update from the case here?
- Mark as New
- Bookmark
- Subscribe
- Mute
- Subscribe to RSS Feed
- Permalink
- Report Inappropriate Content
Sure thing, will do.
- Mark as New
- Bookmark
- Subscribe
- Mute
- Subscribe to RSS Feed
- Permalink
- Report Inappropriate Content
Have not heard anything back from support on this yet. I requested any update on my case this morning. I'll post here if I hear anything...
- Mark as New
- Bookmark
- Subscribe
- Mute
- Subscribe to RSS Feed
- Permalink
- Report Inappropriate Content
My MX65 is showing average device utilization in the Summary email.
My clients are also showing it when I go to Org/Summary Report. The clients have MX64, MX67, MX68 and MX84 firewalls.
- Dave
- Mark as New
- Bookmark
- Subscribe
- Mute
- Subscribe to RSS Feed
- Permalink
- Report Inappropriate Content
device utilization ≠ CPU utilization
As of now you can only get CPU utilization from Meraki support, but there is an empty area for it in the summary reports that I *think* used to populate.
- Mark as New
- Bookmark
- Subscribe
- Mute
- Subscribe to RSS Feed
- Permalink
- Report Inappropriate Content
Support told me that they can't really give an ETA on this since "these kinds of issues are prioritized on many factors". I checked with my Cisco/Meraki architect we partner with, and his response was that this is not normally something exposed to customers, and could be an error on the part of the UI team or something planned to be rolled out. So still not real clarification as to why this graph is showing in Summary Report with "Insufficient Info" for all networks.
- Mark as New
- Bookmark
- Subscribe
- Mute
- Subscribe to RSS Feed
- Permalink
- Report Inappropriate Content
Still nothing from Support on this and I'm still seeing "Insufficient Data" in the utilization graph for all of my MXs in the Summary Report for an individual network. I sent in a request for any update on my case, I'll post any reply I receive.
- Mark as New
- Bookmark
- Subscribe
- Mute
- Subscribe to RSS Feed
- Permalink
- Report Inappropriate Content
Thanks for the update! Exited for the next update from you.
- Mark as New
- Bookmark
- Subscribe
- Mute
- Subscribe to RSS Feed
- Permalink
- Report Inappropriate Content
Been a while, but still nothing from Support on this. They still have my case open, but at this point I'll be pretty surprised to hear anything. Why not just remove that unusable graph from the Summary Report?
- Mark as New
- Bookmark
- Subscribe
- Mute
- Subscribe to RSS Feed
- Permalink
- Report Inappropriate Content
I've reported this issue to support as well. Hope it gets resolved soon.
This may require another thread, but does anyone know the options of sending metric stats out for another system to consume? Via rest posts, API's or SNMP?
- Mark as New
- Bookmark
- Subscribe
- Mute
- Subscribe to RSS Feed
- Permalink
- Report Inappropriate Content
I am seeing utilization as follows.
- Select the desired Network at the top.
- Highlight Organization and then Summary Report under the Monitor menu
- Change Network(s) from "Entire organization" to "A single network"
- Select the appliance of your choice
- It displays below the graph on the lefthand side
- Mark as New
- Bookmark
- Subscribe
- Mute
- Subscribe to RSS Feed
- Permalink
- Report Inappropriate Content
Are we ever going to get the CPU metrics feature? Its ridiculous it takes two hours to get someone to answer your support on a normal work day in the US, and we cant even get the simple metrics of CPU Utilization. So I have to burn 2 hours of my day just to get metrics.
- Mark as New
- Bookmark
- Subscribe
- Mute
- Subscribe to RSS Feed
- Permalink
- Report Inappropriate Content
yes, having access to these metrics would be a massive time and energy saver.
plus the 2 hour support wait times don't help either.
- Mark as New
- Bookmark
- Subscribe
- Mute
- Subscribe to RSS Feed
- Permalink
- Report Inappropriate Content
Check out this documentation for more detail information to date.
-
3rd Party VPN
174 -
ACLs
91 -
Auto VPN
306 -
AWS
36 -
Azure
70 -
Client VPN
383 -
Firewall
868 -
iOS
1 -
Other
557 -
Wireless LAN MR
1


