We're migrating to the Cisco Community on March 29. The Meraki Community will enter read-only mode starting on March 26.
Learn more- Technical Forums
- :
- Developers & APIs
- :
- Re: Meraki API Performance degraded?
Meraki API Performance degraded?
Solved- Subscribe to RSS Feed
- Mark Topic as New
- Mark Topic as Read
- Float this Topic for Current User
- Bookmark
- Subscribe
- Mute
- Printer Friendly Page
- Mark as New
- Bookmark
- Subscribe
- Mute
- Subscribe to RSS Feed
- Permalink
- Report Inappropriate Content
Meraki API Performance degraded?
Hi,
Is there an ongoing issue with the performance of the Meraki Dashboard API?
We've developed software for a number of Meraki SD-WAN customers and in recent days have been experiencing issues with a significant increase in the API reliability and response times.
Whilst requesting data from various endpoints we're seeing issues, which can also be reproduced in Postman
- Some requests are made and never responded to
- Some requests respond with a 200 header, but then don't appear to respond with any payload data.
- Requests that do succeed are taking a lot longer than expected, sadly I don't have precise figures to be able to quantify this, as an example query for the 1st page (300) VPN statuses {{baseUrl}}/organizations/:organizationId/appliance/vpn/statuses takes between 4 and 25 seconds (at 7-7:30pm UK time today). Earlier today I experienced times of > 1min.
This problem was seen with multiple unrelated customer organisations. For example one his hosted on n376.meraki.com and another on n271.meraki.com
Looking at some historical data this issue appears to have started around 11th Jan and has been getting progressively worse. It also appears to be worse from 8am until 8-9pm.
I'm not aware of anywhere to see service status or performance if there is such a thing. But it looks very much like a load issue
Solved! Go to solution.
- Mark as New
- Bookmark
- Subscribe
- Mute
- Subscribe to RSS Feed
- Permalink
- Report Inappropriate Content
I think if you check now, you should find the problem fixed.
If not, we had a different problem!
- Mark as New
- Bookmark
- Subscribe
- Mute
- Subscribe to RSS Feed
- Permalink
- Report Inappropriate Content
Hi @Martin_Rowan I am not aware of anything specific being mentioned or discussed in our Meraki Support channels. There is a relatively new discussion forum here on the Community specific to service outage/impairments: https://community.meraki.com/t5/Meraki-Service-Notices/bg-p/service-notices and at this point nothing there either specific to degraded API performance. And that's a valid data point that you are noticing this across multiple Dashboard organizations on different shards.
I would open a ticket with Meraki Support for further investigation, they will be best equipped to correlate your issue with any others and engage with Engineering.
- Mark as New
- Bookmark
- Subscribe
- Mute
- Subscribe to RSS Feed
- Permalink
- Report Inappropriate Content
I've seen similar on n383 over the last couple of weeks, seems to be degrading over time.
From my end (using Meraki Python package), the problem is showing as server disconnects and server not accepting connections, rather than HTTP errors.
I opened a case yesterday, low priority but fast contact back from support, and then provided a lot of detail info to them.
As above, open a case is the best approach.
- Mark as New
- Bookmark
- Subscribe
- Mute
- Subscribe to RSS Feed
- Permalink
- Report Inappropriate Content
Thanks, I've opened a support case.
- Mark as New
- Bookmark
- Subscribe
- Mute
- Subscribe to RSS Feed
- Permalink
- Report Inappropriate Content
@Martin_Rowan I also seem to be having major issues with the API. Lots of calls seem to be timing out and scripts that would normally run < 1 minute are taking 5+ minutes to complete. Wonder what the problem is but I doubt support has any answers 😄
- Mark as New
- Bookmark
- Subscribe
- Mute
- Subscribe to RSS Feed
- Permalink
- Report Inappropriate Content
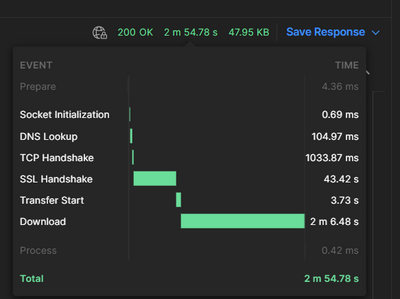
Well the more people that raise tickets the better I guess. Slow responses are annoying, incomplete/truncated responses (invalid json) are something else. An example below took nearly 3 mins and sent ~48k of the 160k expected. The SSL handshake was very long and unusual in that request, most of the time it appears to be the download. It's definitely a lot slower during 8am-9pm timeframe, early this morning a call was still slow 5 seconds, but as the day progresses it has become more erratic and flaky.
- Mark as New
- Bookmark
- Subscribe
- Mute
- Subscribe to RSS Feed
- Permalink
- Report Inappropriate Content
Not sure if this will help some people in the short term. But I make the request directly to the shard endpoint for example: https://n376.meraki.com/api/v1/ then responses are back in milliseconds, whereas going via the API gateway https://api.meraki.com/api/v1 is where it's slow.
- Mark as New
- Bookmark
- Subscribe
- Mute
- Subscribe to RSS Feed
- Permalink
- Report Inappropriate Content
I fed this back to support on the case I opened and gave a link to your post.
They said they're investigating a wider issue than just my case, so good to know they are aware and working on resolution.
- Mark as New
- Bookmark
- Subscribe
- Mute
- Subscribe to RSS Feed
- Permalink
- Report Inappropriate Content
I think if you check now, you should find the problem fixed.
If not, we had a different problem!
- Mark as New
- Bookmark
- Subscribe
- Mute
- Subscribe to RSS Feed
- Permalink
- Report Inappropriate Content
Indeed performance seems to have improved dramatically. Hopefully, we won't see the gradual decline I detected since 11th Jan.
- Mark as New
- Bookmark
- Subscribe
- Mute
- Subscribe to RSS Feed
- Permalink
- Report Inappropriate Content
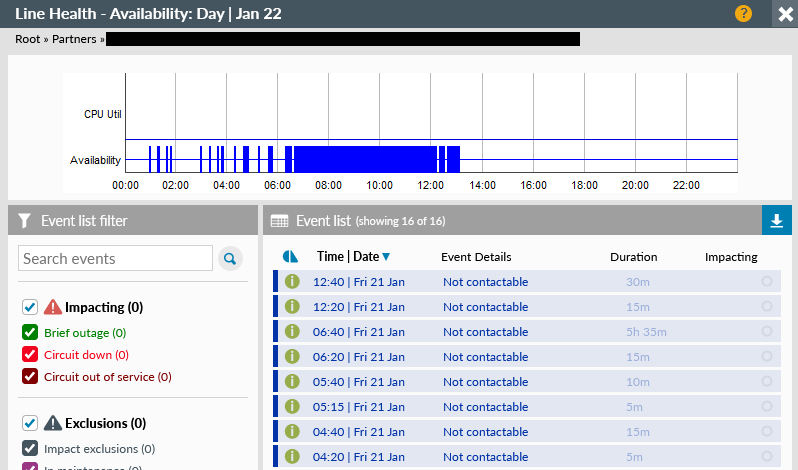
Yes we're seeing the problem fixed at around 13:10 GMT today \o/
COO
Highlight - Service Observability Platform
www.highlight.net
- Mark as New
- Bookmark
- Subscribe
- Mute
- Subscribe to RSS Feed
- Permalink
- Report Inappropriate Content
Are you guys seeing any errors again? Things still seem to timeout for me. Are you still using the API gateway or just making the calls directly to the shard now?
- Mark as New
- Bookmark
- Subscribe
- Mute
- Subscribe to RSS Feed
- Permalink
- Report Inappropriate Content
@AutomationDude Checked again and response times are fine using api.meraki.com not getting timeouts or seeing very slow replies.
- Mark as New
- Bookmark
- Subscribe
- Mute
- Subscribe to RSS Feed
- Permalink
- Report Inappropriate Content
Normal operation still for me, no server disconnects/non-connects, using the gateway.
- Mark as New
- Bookmark
- Subscribe
- Mute
- Subscribe to RSS Feed
- Permalink
- Report Inappropriate Content
Wonder why it's happening to me then.. I'll investigate on my end. Cheers anyway though and have a nice weekend
- Mark as New
- Bookmark
- Subscribe
- Mute
- Subscribe to RSS Feed
- Permalink
- Report Inappropriate Content
We've seen a dramatic increase in API response times too, I've logged a case about it on the 19th, but I couldn't seem more information there.
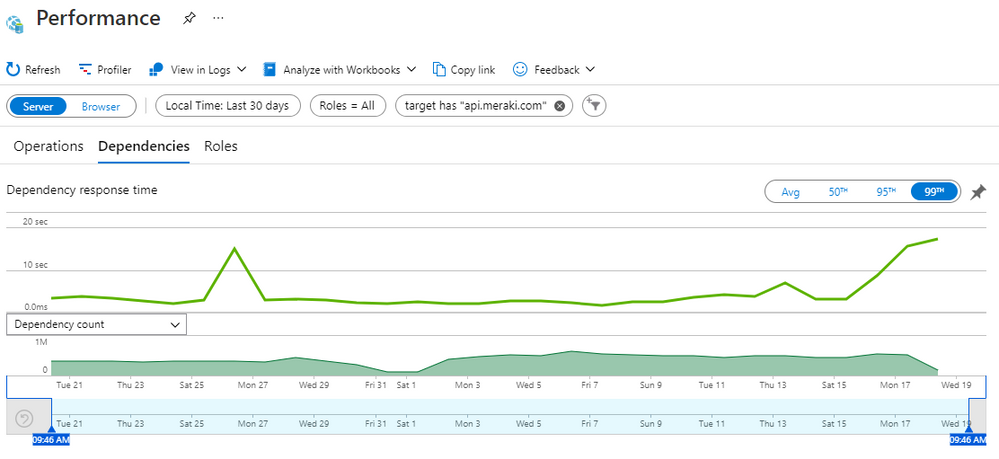
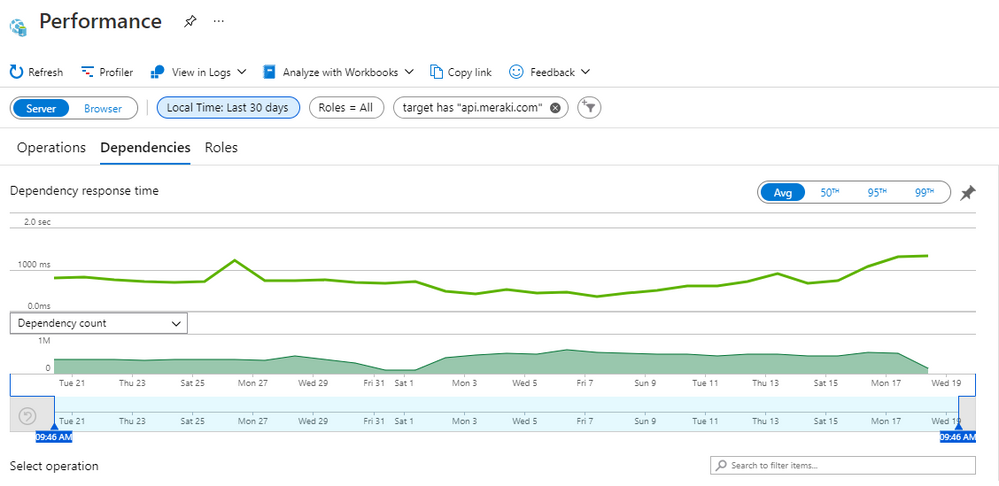
The job that gets all device statuses for a 150-ish organizations went from ~42 sec to ~6 minutes. Calls on specific API shards became significantly slower, the graph would be way higher if the timeout for the API client wasn't 60 seconds, because some calls just took 2-4 minutes to respond.
99th percentile going up:
Averages going up:
- Mark as New
- Bookmark
- Subscribe
- Mute
- Subscribe to RSS Feed
- Permalink
- Report Inappropriate Content
For us the issue was resolved on 21st around midday UTC.
If you still see a problem then I suggest post a comment on the case you opened asking for an update.
- Mark as New
- Bookmark
- Subscribe
- Mute
- Subscribe to RSS Feed
- Permalink
- Report Inappropriate Content
Yeah our issues have been resolved.
- Mark as New
- Bookmark
- Subscribe
- Mute
- Subscribe to RSS Feed
- Permalink
- Report Inappropriate Content
Can you confirm which API Endpoints you're using?
We have an issue where some times API requests don't respond before an internal timeout (60 seconds), I sometimes see the same issue using just PostMan, as a result, we changed our implementation to have an additional retry policy, such that if we don't start to get a reply within a second, we drop that request and make it again (after a short delay). This has improved the overall reliability significantly. Not sure if you're hitting the same issue.
- Mark as New
- Bookmark
- Subscribe
- Mute
- Subscribe to RSS Feed
- Permalink
- Report Inappropriate Content
@Martin_Rowan I was having slow responses on:
GET /v1/networks/{networkId}/firmwareUpgrades
GET /v1/organizations/{organizationId}/devices
GET /v1/organizations/{organizationId}/devices/statuses
I'm temporarily applying the same strategy as well: implemented a lower timeout and retries but that's just putting on a band aid unfortunately.
- Mark as New
- Bookmark
- Subscribe
- Mute
- Subscribe to RSS Feed
- Permalink
- Report Inappropriate Content
I'm running a script that loops through many orgs and it's quite clear that certain orgs on specific shards are experiencing a ton of latency. Most of the orgs however are doing just fine. It also seems to be specific API calls on specific orgs that are timing out.
- Mark as New
- Bookmark
- Subscribe
- Mute
- Subscribe to RSS Feed
- Permalink
- Report Inappropriate Content
I've also experienced time out on several of my scripts runneing API calls. I have narrowed it down to n146.meraki.com timing out. Contaced Meraki Support, but they have no solutions.
- Mark as New
- Bookmark
- Subscribe
- Mute
- Subscribe to RSS Feed
- Permalink
- Report Inappropriate Content
Yep, it's the same shard for me thats causing issues. Doubt Meraki support can do anything about this, the problem is likely to be at a much deeper level.
- Mark as New
- Bookmark
- Subscribe
- Mute
- Subscribe to RSS Feed
- Permalink
- Report Inappropriate Content
You need to persuade them to open an internal case with the Dashboard-API support team.
- Mark as New
- Bookmark
- Subscribe
- Mute
- Subscribe to RSS Feed
- Permalink
- Report Inappropriate Content
It's already done! But they can't say anything......
-
Bluetooth
3 -
Captive Portal API
11 -
Code Sample
63 -
Dashboard API
376 -
Getting Started
10 -
Other
6 -
Python
13 -
Scanning API
28 -
Updates from Meraki
50 -
Webhooks
19 -
Webinars
6


