We're migrating to the Cisco Community on March 29. The Meraki Community will enter read-only mode starting on March 26.
Learn more- Technical Forums
- :
- Full-Stack & Network-Wide
- :
- Re: Check or Monitor Live per client traffic?
Check or Monitor Live per client traffic?
- Subscribe to RSS Feed
- Mark Topic as New
- Mark Topic as Read
- Float this Topic for Current User
- Bookmark
- Subscribe
- Mute
- Printer Friendly Page
- Mark as New
- Bookmark
- Subscribe
- Mute
- Subscribe to RSS Feed
- Permalink
- Report Inappropriate Content
Check or Monitor Live per client traffic?
Typical scenario - MX showing Live Uplink traffic scrolling across screen at max download speed of WAN connection. Knowing the dashboard well, with limits in place, etc. I want to know who the offending clients (wired and wireless) that are using up all the bandwidth - is this possible?
- Security Appliance shows live uplink traffic
- Switch shows per switch per client historically.
- Wireless shows live clients traffic per AP - I want across all clients (wired and wireless)
- Mark as New
- Bookmark
- Subscribe
- Mute
- Subscribe to RSS Feed
- Permalink
- Report Inappropriate Content
Once you turn on detailed traffic analysis under network wide>general Traffic analysis a new tab will be under network wide> traffic analytics to see what your asking for.
- Mark as New
- Bookmark
- Subscribe
- Mute
- Subscribe to RSS Feed
- Permalink
- Report Inappropriate Content
@DCooper wrote:Once you turn on detailed traffic analysis under network wide>general Traffic analysis a new tab will be under network wide> traffic analytics to see what your asking for.
But the tightest you can filter the data on that page is for the last 2 hours. So to quickly diagnose a spike in traffic it would be nice to be able to see live data or maybe even just the last 5 minutes.
If this was helpful click the Kudo button below
If my reply solved your issue, please mark it as a solution.
- Mark as New
- Bookmark
- Subscribe
- Mute
- Subscribe to RSS Feed
- Permalink
- Report Inappropriate Content
Thanks for the reply.
Yes, have that turned on already. Traffic Analytics is historical, not live that I'm asking for, similar to AP status but across all clients.
- Mark as New
- Bookmark
- Subscribe
- Mute
- Subscribe to RSS Feed
- Permalink
- Report Inappropriate Content
Netflow, radius accounting(basic) or pulling from the API(which would be a bit of delay but you could format time slices how you'd like) those are the only options beyond what I mentioned.
- Mark as New
- Bookmark
- Subscribe
- Mute
- Subscribe to RSS Feed
- Permalink
- Report Inappropriate Content
ok. Thanks for the suggestions outside of Dashboard.
Seems like a future Dashboard enhancement request then, as it's available per AP per client today in Dashboard today.
And would Insight help here?
- Mark as New
- Bookmark
- Subscribe
- Mute
- Subscribe to RSS Feed
- Permalink
- Report Inappropriate Content
Packet Capture for 2 to 5 minutes + Wireshark.
- Mark as New
- Bookmark
- Subscribe
- Mute
- Subscribe to RSS Feed
- Permalink
- Report Inappropriate Content
@PhilipDAth wrote:Packet Capture for 2 to 5 minutes + Wireshark.
Do what Philip said and when your capture is open in Wireshark click Statistics>Endpoints. Click the IPv4 tab and sort by bytes.
Would be nice though if Meraki had a smaller window than 2 hour or even a live statistics option for tracking down these sorts of things from within the dashboard.
If this was helpful click the Kudo button below
If my reply solved your issue, please mark it as a solution.
- Mark as New
- Bookmark
- Subscribe
- Mute
- Subscribe to RSS Feed
- Permalink
- Report Inappropriate Content
Created a "Wish" post.
- Mark as New
- Bookmark
- Subscribe
- Mute
- Subscribe to RSS Feed
- Permalink
- Report Inappropriate Content
@DCooper, Radius Accounting isn't available on the MX is it? And can you pull the data with the dashboard API with an MX? If so, can you link what API endpoint you would use here? For some reason, I haven't seen anything that I thought would work for this purpose, but could have missed it!
- Mark as New
- Bookmark
- Subscribe
- Mute
- Subscribe to RSS Feed
- Permalink
- Report Inappropriate Content
If anyone else is wanting to use the API to get more granular detail, here is the endpoint you need to use: https://dashboard.meraki.com/api_docs#clients
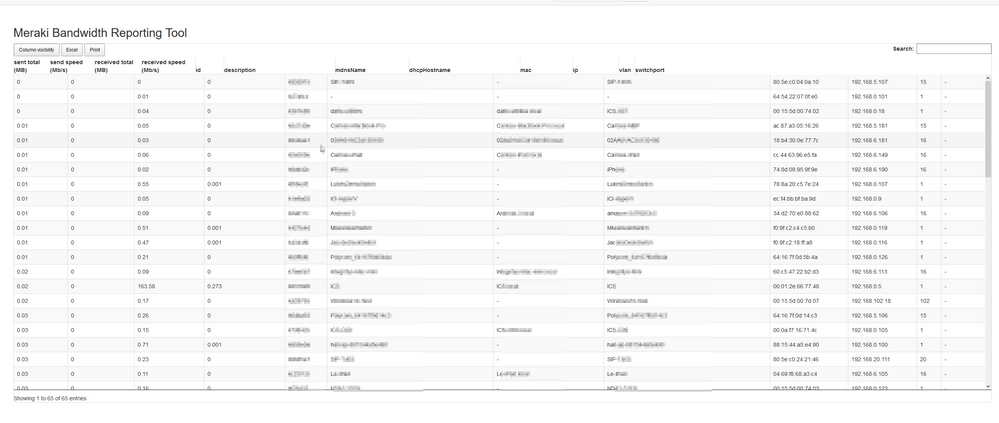
I'm honestly not sure how accurate it is when you start looking at smaller time slices (600 sec or less), but it seems to be working pretty well.
Here's a snapshot of a quick dashboard I wrote that will display the stats for the serial # that I enter:
- Mark as New
- Bookmark
- Subscribe
- Mute
- Subscribe to RSS Feed
- Permalink
- Report Inappropriate Content
- Mark as New
- Bookmark
- Subscribe
- Mute
- Subscribe to RSS Feed
- Permalink
- Report Inappropriate Content
@DCooper It actually isn't hitting a database. Just pulling in the JSON and massaging a bit then dumping it into an HTML table.
- Mark as New
- Bookmark
- Subscribe
- Mute
- Subscribe to RSS Feed
- Permalink
- Report Inappropriate Content
Hi. I am affraid the link to the API call is broken. Can you repost? Thank you in advance.
- Mark as New
- Bookmark
- Subscribe
- Mute
- Subscribe to RSS Feed
- Permalink
- Report Inappropriate Content
I totally agree that we need better real time visibility in the MX. When there is a bandwidth issue, the "last 2 hour" view isn't granular enough to diagnose an issue.

