Get answers from our community of experts in record time.
Join now- Technical Forums
- :
- Dashboard & Administration
- :
- Re: MX CPU / MEM overview in dashboard ?
MX CPU / MEM overview in dashboard ?
Solved- Subscribe to RSS Feed
- Mark Topic as New
- Mark Topic as Read
- Float this Topic for Current User
- Bookmark
- Subscribe
- Mute
- Printer Friendly Page
- Mark as New
- Bookmark
- Subscribe
- Mute
- Subscribe to RSS Feed
- Permalink
- Report Inappropriate Content
MX CPU / MEM overview in dashboard ?
Hi All !
I'm looking for the graphs displayed in this link
https://documentation.meraki.com/MX/Monitoring_and_Reporting/Device_Utilization
They boast about the ability to see exiting stuff in the summary report ..
I guess I haven't configured my report right, because I can't seem to locate the kind of graph they hint at ..
Any suggestions ?
With Highest Regards
Thyge
Solved! Go to solution.
- Mark as New
- Bookmark
- Subscribe
- Mute
- Subscribe to RSS Feed
- Permalink
- Report Inappropriate Content
- Mark as New
- Bookmark
- Subscribe
- Mute
- Subscribe to RSS Feed
- Permalink
- Report Inappropriate Content
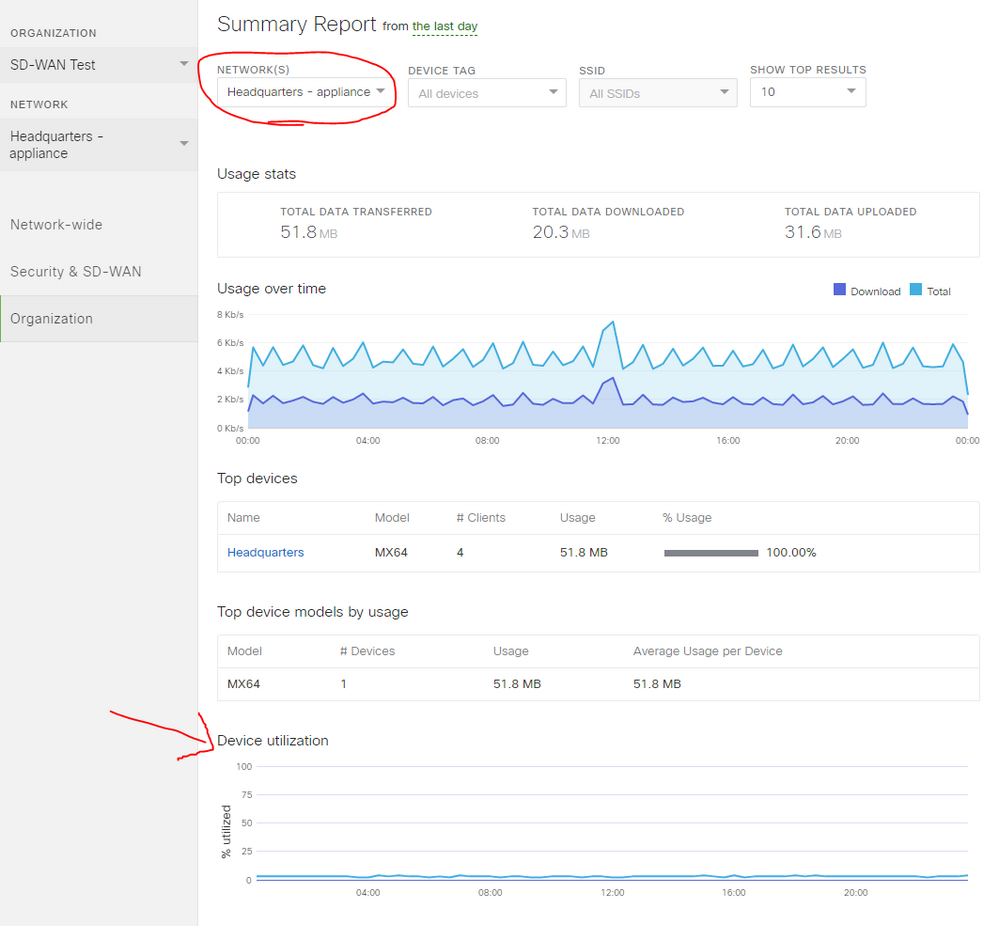
Organization 》 summary report
Make sure to select a network with mx. It should be on the bottom left
- Mark as New
- Bookmark
- Subscribe
- Mute
- Subscribe to RSS Feed
- Permalink
- Report Inappropriate Content
Hi ..
The summary report is there, but there is not the graph mentioned ..
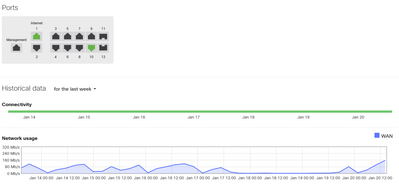
The MX is also there, as You can see here:
/ Thyge
- Mark as New
- Bookmark
- Subscribe
- Mute
- Subscribe to RSS Feed
- Permalink
- Report Inappropriate Content
And you made sure the mx is selected (top left, networks(s), A single network) of summary report?
- Mark as New
- Bookmark
- Subscribe
- Mute
- Subscribe to RSS Feed
- Permalink
- Report Inappropriate Content
- Mark as New
- Bookmark
- Subscribe
- Mute
- Subscribe to RSS Feed
- Permalink
- Report Inappropriate Content
- Mark as New
- Bookmark
- Subscribe
- Mute
- Subscribe to RSS Feed
- Permalink
- Report Inappropriate Content
I wish I could give double kudos to @jdsilva . It is critical you have a network selected. If you have "Organization" selected for the summary report you don't get utilization graphs.
- Mark as New
- Bookmark
- Subscribe
- Mute
- Subscribe to RSS Feed
- Permalink
- Report Inappropriate Content
I highly agree !! 2xKudo's from mee too!
WOW That sure did the trick ..
THANX a LOT !!
With highest Regards
Thyge
- Mark as New
- Bookmark
- Subscribe
- Mute
- Subscribe to RSS Feed
- Permalink
- Report Inappropriate Content
Thanx a LOT, jdsilva!
That did it! How great, that You are awake, and can guide a rookie like me !
I whish I could give more than one Kudo, since the answer was swift, exact and illustrative, all at the same time ..
Thanx 😀 from the high North (Denmark 😱)
With highest regards
Thyge
- Mark as New
- Bookmark
- Subscribe
- Mute
- Subscribe to RSS Feed
- Permalink
- Report Inappropriate Content
Regarding my image (with the ports)
😉Yep, got it .. It was just to show that the network actually had a MX device 🙂
I found the reason (marked very green in the thread) thanx to You all ..
I'm humbled 😉
With highest regards
Thyge
-
Administrators
238 -
Change log
15 -
Firmware upgrades
31 -
Inventory
48 -
Licensing
78 -
Meraki mobile app
12 -
Other
175


