Get answers from our community of experts in record time.
Join now- Technical Forums
- :
- Dashboard & Administration
- :
- Re: Can I get service Availability report of all Meraki devices from Meraki...
Can I get service Availability report of all Meraki devices from Meraki Dashboard
- Subscribe to RSS Feed
- Mark Topic as New
- Mark Topic as Read
- Float this Topic for Current User
- Bookmark
- Subscribe
- Mute
- Printer Friendly Page
- Mark as New
- Bookmark
- Subscribe
- Mute
- Subscribe to RSS Feed
- Permalink
- Report Inappropriate Content
Can I get service Availability report of all Meraki devices from Meraki Dashboard
Hello Folks, Greetings for the day.
Can anyone please let me know if we can get a Service Availability report of all Meraki devices from Meraki Dashboard or not? If not, what is the best possible way to do it?
Thanks as always.
Regards,
Kavy
- Mark as New
- Bookmark
- Subscribe
- Mute
- Subscribe to RSS Feed
- Permalink
- Report Inappropriate Content
Hi Kavy,
Just to clarify, when you say Service Availability do we mean the uptime of the MX in a particular timeframe?
i.e. Uptime of MX for a period of 7 days.
- Mark as New
- Bookmark
- Subscribe
- Mute
- Subscribe to RSS Feed
- Permalink
- Report Inappropriate Content
Hey @MariaP8 , Thanks for the response.
I'm looking for the uptime of all the MX, MS, MR devices in our organisation for last one month. Is there anywhere I can find it?
- Mark as New
- Bookmark
- Subscribe
- Mute
- Subscribe to RSS Feed
- Permalink
- Report Inappropriate Content
Being able to see this information is relatively new to the Dashboard, and is only visible on the MS and MR products, not the MX appliances.
I thought maybe you can leverage the API to pull this info but I didn't see anything there either.
https://developer.cisco.com/meraki/api-v1/overview/
Unless you can get it from support you might be out of luck I am afraid.
- Mark as New
- Bookmark
- Subscribe
- Mute
- Subscribe to RSS Feed
- Permalink
- Report Inappropriate Content
Hi Kavy,
@Arthamon is correct regarding the Dashboard uptime visibility and the API. Uptime statistics from the dashboard at this point in time are relatively limited.
For statistics on uptime you can use the Organization > Overview page. This won't provide you with the specific uptime of the device unfortunately.
The other option is to manually view each MR and MS to check the uptime (MS needs to be on firmware 15.21.1+ and MR on 30.x+).
Options:
1. Go to Organization > Overview. Then select the tab that says "Devices". You can see each of the connectivity bars there. Unfortunately it does not give you an uptime metric, but it does give you the dates of when the device was connected to the Cloud or not.
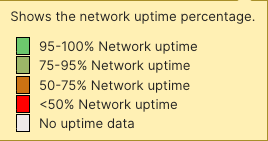
2. Go to Organization > Overview. Select the "Networks tab". Click on the "+" sign next to the CSV button. Select "network health" and "% offline" from the "+" dropdown.
3. Go to Switching > Switches and select your switch and view the uptime there.
4. Go to Wireless > Access points and select your AP and view the uptime there.
-
Administrators
216 -
Change log
12 -
Firmware upgrades
27 -
Inventory
43 -
Licensing
73 -
Meraki mobile app
12 -
Other
154


