- Technical Forums
- :
- Wireless
- :
- Re: Report on peak concurrent clients on dashboard
Report on peak concurrent clients on dashboard
- Subscribe to RSS Feed
- Mark Topic as New
- Mark Topic as Read
- Float this Topic for Current User
- Bookmark
- Subscribe
- Mute
- Printer Friendly Page
- Mark as New
- Bookmark
- Subscribe
- Mute
- Subscribe to RSS Feed
- Permalink
- Report Inappropriate Content
Report on peak concurrent clients on dashboard
Hi,
Is there a quick way to report on the peak client count for each AP in a network on the Meraki Dashboard?
We are trying to work out trends, and also list any AP's which are in 'high density' locations (ie constantly over 30 concurrent clients).
Cheers,
Bobby
- Mark as New
- Bookmark
- Subscribe
- Mute
- Subscribe to RSS Feed
- Permalink
- Report Inappropriate Content
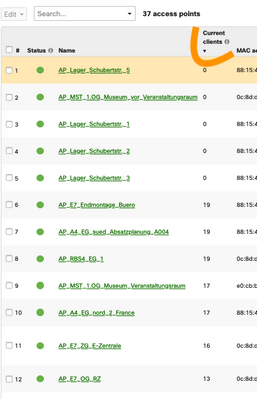
You can sort the list of accesspoint with the number of current clients.
- Mark as New
- Bookmark
- Subscribe
- Mute
- Subscribe to RSS Feed
- Permalink
- Report Inappropriate Content
I was hoping there would be a graph plotting the concurrent clients per AP, did I imagine it, or is it on the dashboard view somewhere, or do I have to put this feature in via the 'make a wish' button? 😎
- Mark as New
- Bookmark
- Subscribe
- Mute
- Subscribe to RSS Feed
- Permalink
- Report Inappropriate Content
Ideally I would like to see a graph and/or stats within the pass month (or select time period) of AP's vs client concurrency number.
- Mark as New
- Bookmark
- Subscribe
- Mute
- Subscribe to RSS Feed
- Permalink
- Report Inappropriate Content
Actually I think I found it, in 'Wireless' -> 'Monitor' -> 'Wireless Troubleshooting' . Now how does one download these stats in say a CSV format??
- Mark as New
- Bookmark
- Subscribe
- Mute
- Subscribe to RSS Feed
- Permalink
- Report Inappropriate Content
You can download the page @redsector mentioned in CSV using the button at the top.
Other than that This API call would probably be the best way to pull this data:
https://api.meraki.com/api_docs#list-the-clients-of-a-device-up-to-a-maximum-of-a-month-ago
- Mark as New
- Bookmark
- Subscribe
- Mute
- Subscribe to RSS Feed
- Permalink
- Report Inappropriate Content
I think if its an API call that's needed, this one looks more inline with what I'm after?
https://api.meraki.com/api_docs#aggregated-connectivity-info-for-this-network-grouped-by-clients
I'm very new to using the API, how does one use the parameters? any tips would be most helpful!
- Mark as New
- Bookmark
- Subscribe
- Mute
- Subscribe to RSS Feed
- Permalink
- Report Inappropriate Content
@Meraki888 the API you reference is part of Wireless Health
https://documentation.meraki.com/MR/Wireless_Health
It's not going to tell you the number of clients connected to an AP, it's going to tell you how many failures for various tests have happened over a period of time.
I mean, if that's what you are really after then by all means, use whichever API call gives you the data you want.
The call I suggested will tell you how many clients are connected to a give AP, for the time period specified. It won't give you a count though... It'll give you a blob of JSON with details for each client, you'd then have to count that yourself in the script you're running to hit the API.
For the parameters, using them depends on the method you're using to interact with the API. Personally, I use Python, but to build on the curl example in the docs it'd be like this:
curl -L -H 'X-Cisco-Meraki-API-Key: <key>' -H 'Content-Type: application/json' -X GET 'https://api.meraki.com/api/v0/devices/{serial}/clients?t0=1579274691'
There the value for t0 is a time and date in Epoch time https://en.wikipedia.org/wiki/Unix_time
And timespan is just the number of seconds you want to report on.
- Mark as New
- Bookmark
- Subscribe
- Mute
- Subscribe to RSS Feed
- Permalink
- Report Inappropriate Content
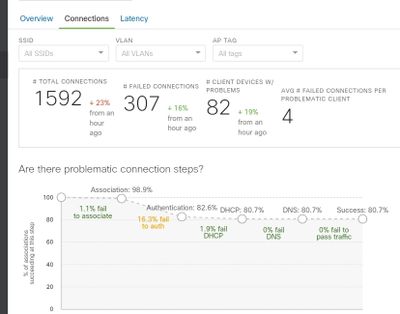
The chart that is providing me the correct information is on the wireless health tab, hence why I chose that API.
I'm after the values for peak concurrent number of clients over a period of time, seems like i would have to write a small program to give me the figures I want.
Would there be an equivalent (and or easier without additional programming) to get this figure via SNMP?
- Mark as New
- Bookmark
- Subscribe
- Mute
- Subscribe to RSS Feed
- Permalink
- Report Inappropriate Content
The only count I can find on the wireless health tab is below, but that is for the whole selected time period. Is that what you are looking for?


