- Technical Forums
- :
- Wireless
- :
- Meraki Syslog data for SSID events? Going into Sumologic
Meraki Syslog data for SSID events? Going into Sumologic
- Subscribe to RSS Feed
- Mark Topic as New
- Mark Topic as Read
- Float this Topic for Current User
- Bookmark
- Subscribe
- Mute
- Printer Friendly Page
- Mark as New
- Bookmark
- Subscribe
- Mute
- Subscribe to RSS Feed
- Permalink
- Report Inappropriate Content
Meraki Syslog data for SSID events? Going into Sumologic
Hi All;
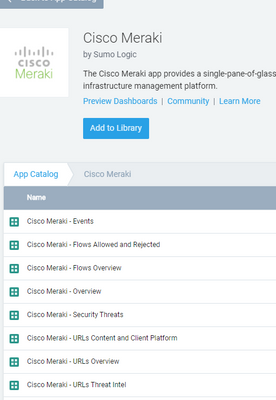
In Sumologic I setup the below app to get Meraki events
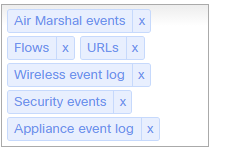
In Meraki the syslog server includes the below roles which populate the above dashboards. So far so good!
I need to create a new dashboard that shows on which SSID a client connected given a specific network or AP, or even better provide network and AP information as part of the results from the query.
The use case that I have is to identify corporate client devices that are unintentionally connecting to the guest wireless ssid or non-corporate client devices connecting to the prod wireless network. To achieve this I need to know under what event type these client device connections are logged under.
Based on feedback from Sumologic support the event types that are going into Sumologic are shown below
The results came back with:
- 8021x_auth
- 8021x_client_deauth
- 8021x_deauth
- 8021x_eap_failure
- 8021x_eap_success
- 8021x_radius_timeout
- association
- association_reject
- cli_set_rad_okc_parms
- cli_set_rad_parms
- cli_set_rad_pmksa_parms
- dfs_event
- disassociation
- multiple_dhcp_servers_detected
- radius_mac_auth
- route_connection_change
- vpn_connectivity_change
- wpa_auth
- wpa_deauth
None of those event types though have info on AP, SSID's, or hostnames.
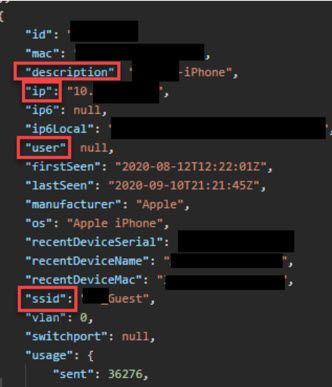
However, running an API call against https://api.meraki.com/api/v1/organizations/{orgID}/networks/{netID}/clients/?perPage=1000&ssidNumbe...
gets me the below info which is what i need to create my dashboard. Is the below information captured in the syslog? and if it is under what event type can i find it?
Thanks in advance!
- Mark as New
- Bookmark
- Subscribe
- Mute
- Subscribe to RSS Feed
- Permalink
- Report Inappropriate Content
Any help on this please?
- Mark as New
- Bookmark
- Subscribe
- Mute
- Subscribe to RSS Feed
- Permalink
- Report Inappropriate Content
@ds2020 you seem to have everything enabled and if the SIEM solution isn't seeing the events you want, they aren't being sent. The best option is to get Sumologic to integrate with the Meraki API, but if that isn't an option then you can create a python script to regularly pull the data down via the API and put it in a file. The SIEM solution should then be able to parse the files.
- Mark as New
- Bookmark
- Subscribe
- Mute
- Subscribe to RSS Feed
- Permalink
- Report Inappropriate Content
@cmr thanks for the reply! What you suggested is actually one of the first things we tried. However, this would require maintaining scripts, file integrity etc and in my opinion would require to much effort to support long term vs Meraki adding the SSID event info to the syslog data.


