- Technical Forums
- :
- Wireless
- :
- Re: Meraki APs overall traffic
Meraki APs overall traffic
- Subscribe to RSS Feed
- Mark Topic as New
- Mark Topic as Read
- Float this Topic for Current User
- Bookmark
- Subscribe
- Mute
- Printer Friendly Page
- Mark as New
- Bookmark
- Subscribe
- Mute
- Subscribe to RSS Feed
- Permalink
- Report Inappropriate Content
Meraki APs overall traffic
Hi,
We are recently doing a security assessment and we see TB traffic going from access points to the meraki dashboard. I don´t know if this is something normal but I went through this link:
and I do see that the APs sends traffic but should this be just statistical traffic and not the real raw traffic. How should I translate this?
- Mark as New
- Bookmark
- Subscribe
- Mute
- Subscribe to RSS Feed
- Permalink
- Report Inappropriate Content
Each Meraki device generates around 1Kb/s of traffic. It would certainly not generate a TB of data.
What makes you think it has generated 1TB of traffic?
You'll need to do a packet capture to get a better understanding on what that traffic really is.
- Mark as New
- Bookmark
- Subscribe
- Mute
- Subscribe to RSS Feed
- Permalink
- Report Inappropriate Content
Hi @nikmagashi , as @PhilipDAth points out, where are you see the data stats in your dashboard? You happy to share a screenshot?
https://www.linkedin.com/in/darrenoconnor/
I'm not an employee of Cisco/Meraki. My posts are based on Meraki best practice and what has worked for me in the field.
- Mark as New
- Bookmark
- Subscribe
- Mute
- Subscribe to RSS Feed
- Permalink
- Report Inappropriate Content
Hi,
We are doing a security assessment and these data are presented via a cloud app security and we clearly see the APs sending 1.7 TB data toward meraki dashboard and thats why we are wondering why APs (meraki MR33) are sending these much data (on 3-4 day period).
- Mark as New
- Bookmark
- Subscribe
- Mute
- Subscribe to RSS Feed
- Permalink
- Report Inappropriate Content
Here is a report from a busy site with 29 APs, 8 switches and 2 MXs for one day, please post your equivalent:
- Mark as New
- Bookmark
- Subscribe
- Mute
- Subscribe to RSS Feed
- Permalink
- Report Inappropriate Content
Hi cmr,
As I mentioned before we see this on the cloud app security (in Azure) that the APs are sending TB data toward meraki dashboard. So the setup seems like this, there is a firewall (fortigate) that sends all data traffic toward a kiwi server (syslog) and from there via ftp these data uploads on the cloud app security which processes the data and presents on a better way (as a report).
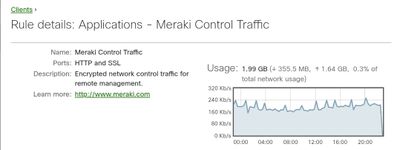
I can see on meraki dashboard this:
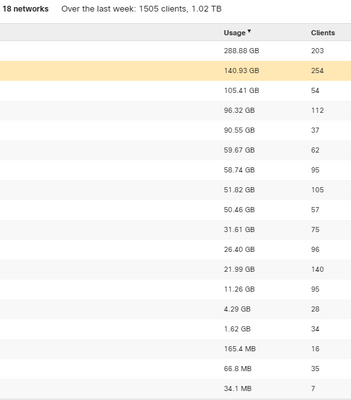
This is a very big organization. The usage for last week is this below:
So, what I am looking to clear it out is this, the data we see here, are these data that are being sent to the meraki dashboard (usage) or are these just statistical data that Meraki reports how much traffic the users have been using. Anyway, on the syslog server we can see that there is this amount of data sent toward the meraki dashboard, so I am guessing this data are not just presented as statistical but these are real data sent toward meraki dashboard. Correct me if I am wrong please.
- Mark as New
- Bookmark
- Subscribe
- Mute
- Subscribe to RSS Feed
- Permalink
- Report Inappropriate Content
The screen scapes that you have provided are purely the amount of traffic seen by the Meraki devices on your premises, not the amount of data sent to the cloud.
The first graph shows all the data, sent and received, that has passed through the Meraki devices on premises for the network from the clients attached to them. In this case it’s over a 30 day time period too. (As a side note 1TB isn’t that much, my family does that on our home network in 30 days - but admittedly there is a lot of streaming in there, damn kids). This is not the traffic sent to the Meraki cloud, it’s just the traffic seen by the devices on premises.
It’s also worth noting that this throughput will include east-west traffic, not just north-south, this is especially true if you have a network where you are accessing internal servers.
- Mark as New
- Bookmark
- Subscribe
- Mute
- Subscribe to RSS Feed
- Permalink
- Report Inappropriate Content
Thank you Bruce for clearing this for me. We have to look more into this back with my team members as to why the syslog server presents this data to us as and this much of traffic sent by the APs toward the Meraki Dashboard.
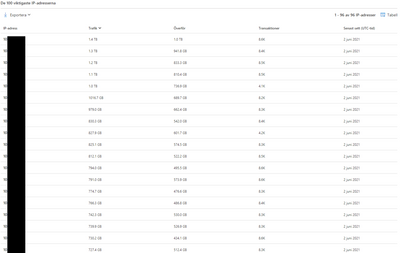
You can see the APs (just some of them who sends most of the traffic) and their amount of traffic sent to Meraki Dashboard.
- Mark as New
- Bookmark
- Subscribe
- Mute
- Subscribe to RSS Feed
- Permalink
- Report Inappropriate Content
Where do you see that it is traffic to the dashboard? In general, what you show looks typical to APs with SSIDs configured with Meraki DHCP where all the client traffic leaves with the AP-IP.
- Mark as New
- Bookmark
- Subscribe
- Mute
- Subscribe to RSS Feed
- Permalink
- Report Inappropriate Content
@nikmagashi, I think you need to have a look at what information the Syslog server is using for its report and where that data is coming from. If it truely is only Syslog then this information isn’t available from the MR. The MR will send flows to a Syslog server with source and destination information, but not the volume of traffic. There must be something else capturing the volume of traffic and sending it to the Syslog server.
What is the report you’ve provided showing? It only show’s a single IP address, is this the source or destination address? What makes you think this is all traffic going to the Meraki cloud?
- Mark as New
- Bookmark
- Subscribe
- Mute
- Subscribe to RSS Feed
- Permalink
- Report Inappropriate Content
We are using kiwi syslog and it is the fortigate who is sending the logs on the kiwi and then from kiwi, we upload the data to cloud app security for better reporting. Meraki is not involved on the data collection. The list with IP that I sent before represent the IP adresses of the meraki APs itself.
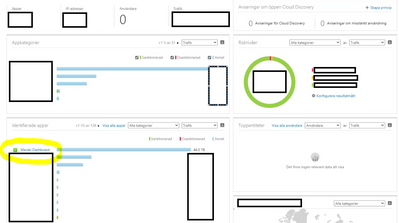
Here is a screenshot of the cloud app security report which takes Meraki Dashboard on first place with 44.5 TB of data sent. Under meraki are other apps for example, Microsoft Teams etc etc, but on top of it is Meraki Dashboard.
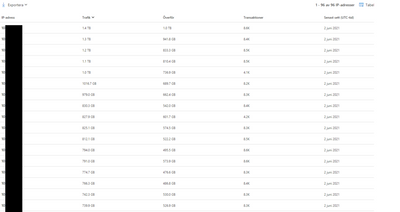
..and when clicking on Meraki Dashboard we get then the IPs below, which belongs to the APs and in this case this means that the APs are sending this amount of traffic toward the meraki dashboard. It is probably normal but It is also a lot for single APs to sent this much traffic on meraki dashboard.
- Mark as New
- Bookmark
- Subscribe
- Mute
- Subscribe to RSS Feed
- Permalink
- Report Inappropriate Content
@nikmagashi how are you defining traffic to "Meraki Dashboard" on the Fortigate?
- Mark as New
- Bookmark
- Subscribe
- Mute
- Subscribe to RSS Feed
- Permalink
- Report Inappropriate Content
No, the traffic from the APs (mgmt vlan) goes through the internet (destination ALL). There is no defining in this case if you are asking about this.
- Mark as New
- Bookmark
- Subscribe
- Mute
- Subscribe to RSS Feed
- Permalink
- Report Inappropriate Content
@nikmagashi do you have any SSIDs that use Meraki DHCP (a guest SSID for example)? If you do then all this traffic will be included in that selection.
- Mark as New
- Bookmark
- Subscribe
- Mute
- Subscribe to RSS Feed
- Permalink
- Report Inappropriate Content
Yes we do have open SSID but they get IP addresses from a sever on a lan.
- Mark as New
- Bookmark
- Subscribe
- Mute
- Subscribe to RSS Feed
- Permalink
- Report Inappropriate Content
I don't know what to say - but the Azure reporting tool is wrong. I wouldn't trust any data out of it.
- Mark as New
- Bookmark
- Subscribe
- Mute
- Subscribe to RSS Feed
- Permalink
- Report Inappropriate Content
Hi PhilipDAth,
I do have my own suspicions also, but we will check and see what is going on there. Anyway thank you all for giving me different views on this case. I really appreciate this.
