- Technical Forums
- :
- Security & SD-WAN
- :
- Re: Why Can't I Apply Traffic Shaping Rules to Miscellaneous Secure Web Tra...
Why Can't I Apply Traffic Shaping Rules to Miscellaneous Secure Web Traffic
- Subscribe to RSS Feed
- Mark Topic as New
- Mark Topic as Read
- Float this Topic for Current User
- Bookmark
- Subscribe
- Mute
- Printer Friendly Page
- Mark as New
- Bookmark
- Subscribe
- Mute
- Subscribe to RSS Feed
- Permalink
- Report Inappropriate Content
Why Can't I Apply Traffic Shaping Rules to Miscellaneous Secure Web Traffic
Hi,
I've got a 100MB leased connection coming in to the building which give me about 90MB of useable bandwidth.
I'm trying to get the packet loss peaks to under 1% to make it compliant with the VoIP requirements for a new VoIP service we are bringing in.
I've restricted all the Traffic Shaping categories to work within a 50MB limit apart from file sharing, backups and antivirus updates that get 20MB.
I've put these restrictions in place but I can't restrict Miscellaneous Secure Web Traffic for some reason. Our technical has advised me to try a per client limit of 10MB. But that's not going to help matters if I've got 10 people all maxing the bandwidth limit for Miscellaneous Secure Web,
Is their another way to restrict Miscellaneous Secure Web Traffic that I'm missing?
dman
- Mark as New
- Bookmark
- Subscribe
- Mute
- Subscribe to RSS Feed
- Permalink
- Report Inappropriate Content
I would suggest to create an aggressive rule for VOIP traffic. This will prioritize your VOIP traffic all the time.
- Mark as New
- Bookmark
- Subscribe
- Mute
- Subscribe to RSS Feed
- Permalink
- Report Inappropriate Content
I already have that in place but Meraki still occasionally gives less than perfect VoIP quality if the bandwidth starts getting squeezed. Packet loss starts showing above 1% in the Uplink monitor.
I don't know why they just can't add Misc secure web to the traffic shaping options globally then I can keep the entire network operating within a set bandwidth.
- Mark as New
- Bookmark
- Subscribe
- Mute
- Subscribe to RSS Feed
- Permalink
- Report Inappropriate Content
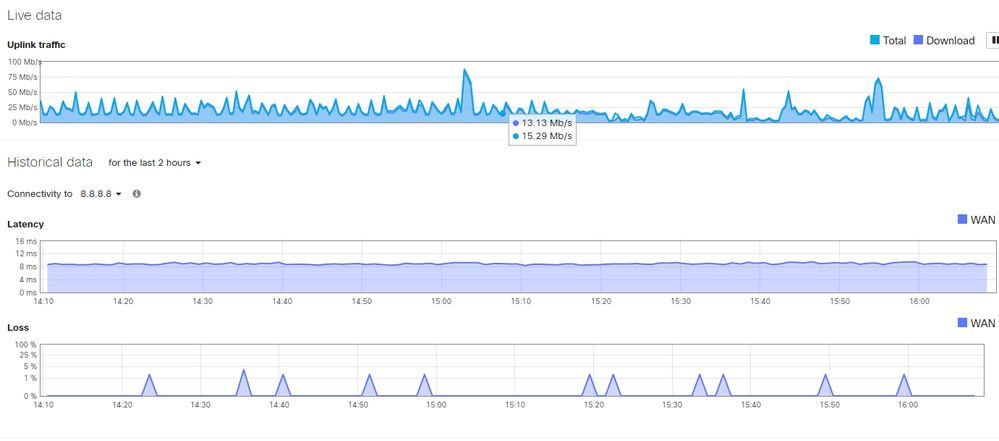
Just taken this screenshot showing the packet loss. Don't even have much traffic going through it at the moment.
When I do a 1000 ping test from my computer it doesn't show any packet loss.
- Mark as New
- Bookmark
- Subscribe
- Mute
- Subscribe to RSS Feed
- Permalink
- Report Inappropriate Content
So by default we get ping google dns (8.8.8.8) to build up loss and latency graphs on dashboard.
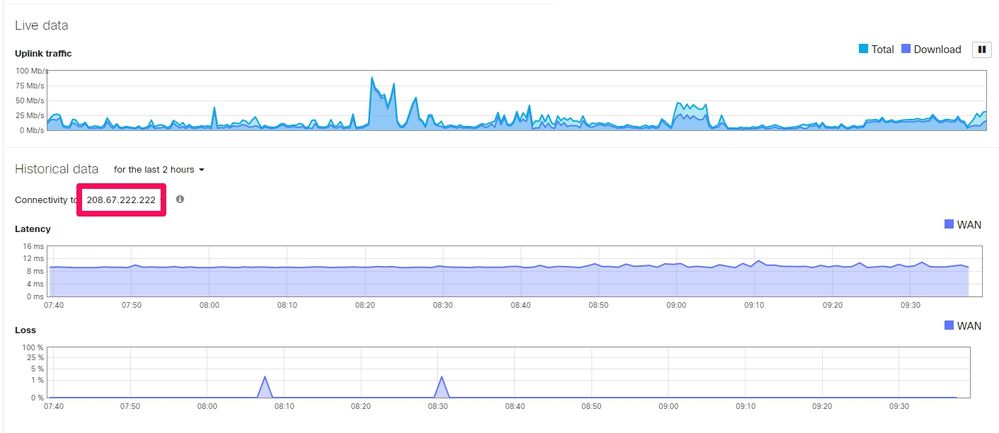
Please configure Cisco Umbrella DNS IP as reference and see if you see same delay and loss.
Cisco Umbrella IP addresses.
- 208.67.222.222.
- 208.67.220.220
- Mark as New
- Bookmark
- Subscribe
- Mute
- Subscribe to RSS Feed
- Permalink
- Report Inappropriate Content
I've added the connectivity stats below of the Cisco Umbrella IP address alongside the 8x8 for the last two hours:
The other strange thing is, whichever IP I'm measuring when you switch from the 2 hour view to the day view. The percentage value of the same loss peaks goes from 1.7% to 0.3%. Which value is the true value. The day vue 0.3% or the 2 hour view where the same peaks reach 1.7%?
- Mark as New
- Bookmark
- Subscribe
- Mute
- Subscribe to RSS Feed
- Permalink
- Report Inappropriate Content
Use Meraki Insight for better understanding you WAN health.
It will also be able to help you with VOIP health. Gives meaningful data in just few clicks and provides you the pain points in the data path.
- Mark as New
- Bookmark
- Subscribe
- Mute
- Subscribe to RSS Feed
- Permalink
- Report Inappropriate Content
They are both the average percentage lost over the sample time. For the 2 hour graph there is a shorter sample time so as packet loss is usually intermittent tiny periods of loss, you end up with longer sample times showing less average loss.
i.e. 100% loss for 1 second
If the 2 hour graph has a 2s sample time it will show 50% loss
If the 1 day graph has a 10s sample time it will show 10% loss
-
3rd Party VPN
168 -
ACLs
101 -
Auto VPN
313 -
AWS
38 -
Azure
70 -
Client VPN
428 -
Firewall
704 -
Other
591


