- Technical Forums
- :
- Security & SD-WAN
- :
- Re: MX64 missing uplink stats since Nov2020 monthly report
MX64 missing uplink stats since Nov2020 monthly report
- Subscribe to RSS Feed
- Mark Topic as New
- Mark Topic as Read
- Float this Topic for Current User
- Bookmark
- Subscribe
- Mute
- Printer Friendly Page
- Mark as New
- Bookmark
- Subscribe
- Mute
- Subscribe to RSS Feed
- Permalink
- Report Inappropriate Content
MX64 missing uplink stats since Nov2020 monthly report
Hello Meraki Community:
1) I just find out, after reviewing the MX64 monthly report that I configured to be send to my email, that the "Uplinks" table stats are in zero values and 100 Loss Rate % since Nov2020 report. This isn't true as my ISP service has been working up the last months without significant issues, also in the reports before Nov2020 when ISP had outages or intermittencies, those failures were reflected in the respective monthly report.
Regards.
- Mark as New
- Bookmark
- Subscribe
- Mute
- Subscribe to RSS Feed
- Permalink
- Report Inappropriate Content
@rledsti if you look at the live uplink stats, are they correct? If so, when you go to the Summary Report how does that look?
Another element to consider is the firmware version, are you running 15.42 or an older release?
- Mark as New
- Bookmark
- Subscribe
- Mute
- Subscribe to RSS Feed
- Permalink
- Report Inappropriate Content
Hello @cmr
1) I generate a "Summary Report", from Jan 1st up today, however, the "Uplinks" field only says: "There are no uplinks for the selected period"
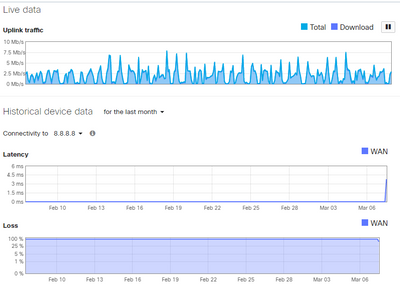
2) The live uplink stats are working, however I find out that "historical device data" wasn't collecting any data for more than 1 month even for Google DNS. With a "nslookup" I checked the Youtube Public IP (my past default SD-WAN & traffic shaping - Uplink statistics), finding that it changed from 172.x.x.x to 142.250.78.174, so, I changed it in SD-WAN & traffic shaping - Uplink statistics, also the Google DNS IP as the new default, and it started to plot again:
3) The current version is MX 14.53 (up to date).
Regards.
- Mark as New
- Bookmark
- Subscribe
- Mute
- Subscribe to RSS Feed
- Permalink
- Report Inappropriate Content
I believe that the uplink stats are primarily determined by the servers you have configured under SD-WAN & traffic shaping -> Uplink statistics. And the loss statistics are based on the loss of ICMP echo requests to the default server. So if you’ve changed that server to say your ISPs DNS server, and then your ISP starts blocking ICMP echo requests then you’ll see 100% loss. It’s a crude measure, but gives a basic view of the link. Check what your servers are here, and whether they’re still accepting ICMP echo requests.
- Mark as New
- Bookmark
- Subscribe
- Mute
- Subscribe to RSS Feed
- Permalink
- Report Inappropriate Content
Hello @Bruce
1) As I wrote above, the live uplink stats are working, however I find out that "historical device data" wasn't collecting any data for more than 1 month even for Google DNS. With a "nslookup" I checked the Youtube Public IP (my past default SD-WAN & traffic shaping - Uplink statistics), finding that it changed from 172.x.x.x to 142.250.78.174, so, I changed it in SD-WAN & traffic shaping - Uplink statistics, and it started to plot again. Also I changed the Google DNS IP as the new default:
2) If you said that "I believe that the uplink stats are primarily determined by the servers you have configured under SD-WAN & traffic shaping -> Uplink statistics", also the "Uplink stats" for Summary Report rely on the connectivity to default "SD-WAN & traffic shaping -> Uplink statistics" IP, right? As with "nslookup" I find out that Youtube Public IP (my former default) changed, so, the "Uplink statistics" default IP should be one that never changes, as Google DNS, right?.
Regards.
- Mark as New
- Bookmark
- Subscribe
- Mute
- Subscribe to RSS Feed
- Permalink
- Report Inappropriate Content
Hi @rledsti, my approach is to have the default server set to one that I’m pretty sure is going to respond. My default is set to Google DNS, then I also have the Umbrella DNS configured, and my ISPs DNS configured too. I notice that the Google and Umbrella DNS are far more reliable, even when I have no loss on them I sometimes see packet loss to my ISPs DNS server - so I leave the Google DNS as my default.
-
3rd Party VPN
162 -
ACLs
101 -
Auto VPN
297 -
AWS
37 -
Azure
69 -
Client VPN
428 -
Firewall
591 -
Other
565


