Meraki Extreme Makeover with LucidCharts

Meraki Extreme Makeover with LucidCharts

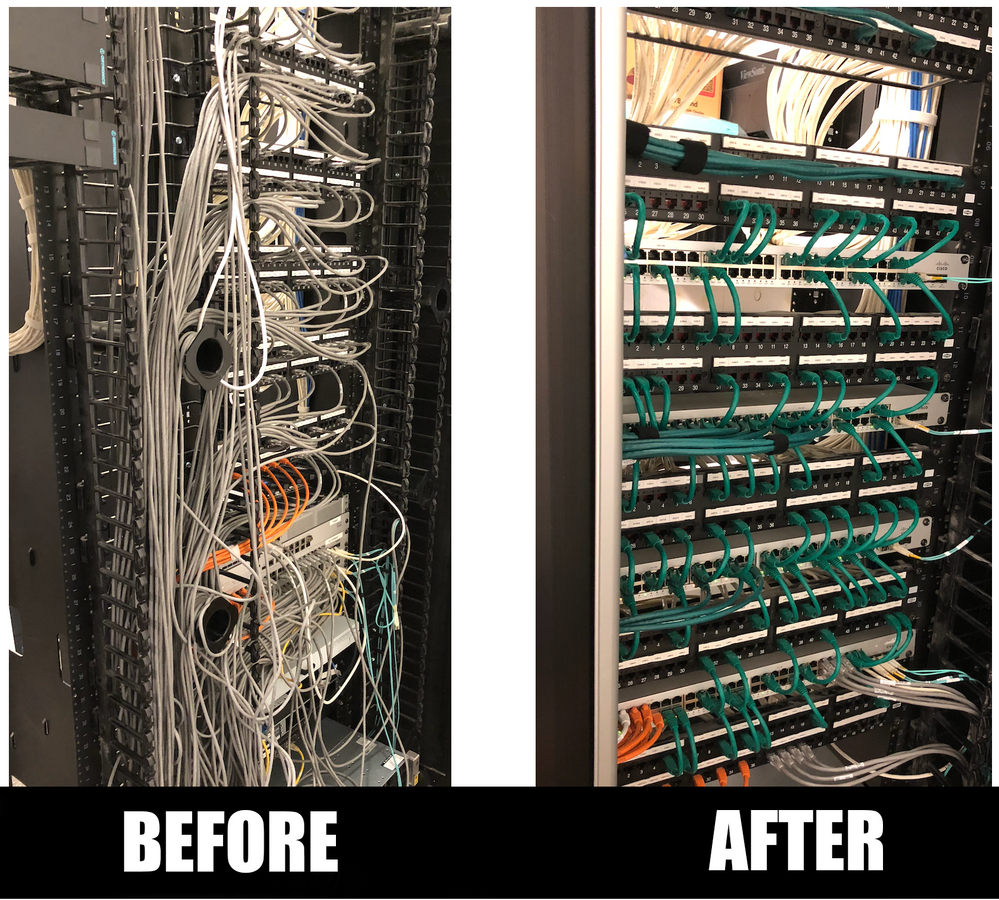
While the Meraki offering makes things a lot easier to manage the day to day items at a logical level. However at the physical layer when something goes wrong you need to be buttoned up. Even though no one will ever see this (usually) it does make a lot of difference for TTR numbers. 


Project objective:

To be able to identify each run to provide faster resolution to network issues while creating a dynamically updated network and allocation status to various departments. 


Scope:

Four buildings that were interconnected via Meraki site-to-site hub( mesh), a mixture of 30 Meraki switches, a mixture of various Meraki MX firewalls and 50 MR access points. 


Outcome:

By using Meraki's offerings we linked into LucidCharts so that anyone in the team or designated department could know a port status. This allowed for quick visual identification and made it easier for tier 1 support folks to understand the various states of the network. This also allowed us to tag certain ports which had to adhere to compliance requirements 


Comments
PhilipDAth
Kind of a big deal

How did you link into LucidChart?

DarrenOC
Kind of a big deal

Ditto, we use Lucidcharts. How did you integrate the two?

Jwiley78
Building a reputation

I would like to know also.  I've been manually creating Lucide Charts all week for new clients.  To link this with Meraki would be awesome.

ERamon
Conversationalist

Hi All - 


I wish there was a more elegant manner to say how it linked up but here are the core steps and video links needed. Also please note, I do not use this solution to show up/down states in realtime.... reason there appears to be a 2-minute polling frequency from Meraki. In addition, when you place in LucidCharts delay... about 1 minute (if the digram is open) you are looking at a 3 to 5-minute possible delay. My preference is to conduct a 60-second polling interval externally mixed with logs that are streaming out to my ELK stack. 


For me, this solution is more eye candy,  a method to share the information which is not real-time and most importantly to bring in proper governance/change control to the network. 


Tools Needed Version 1:

- LucidCharts account that allows data linking

- Floor plan (whatever image you want to you use as a base to overlay network data on)

 (Here is a video link on how to actually link: https://www.youtube.com/watch?v=EkCJzx7HAAc  )

- Google Sheets (The middle man) 

- Initial network dump via Meraki CSV file of port configuration 

- Update workflow & documentation requirements (<-- This is the true key)


Tools Needed Version 2 [Work in Progress]:

- LucidCharts account that allows data linking

- Floor plan (whatever image you want to you use as a base to overlay network data on)

 (Here is a video link on how to actually link: https://www.youtube.com/watch?v=EkCJzx7HAAc  )

- Google Sheets 

- Update workflow & documentation requirements (<-- This is the true key)

- *** Make Meraki API calls that transfer into JSON to update Google Sheets. Still working on this.


[I would give you all detailed steps but I do not have a Meraki switch in my lab environment.... pssssst Meraki Gods any way I can get a small Switch with POE to develop against? XOXO) 


VERSION 1:

Step 1 -

Export your data to CSV


Step 2 - 

Import data into a Google Sheet and clean up the data to be sure it's normalized. I would say this was a bigger task than I thought since there were different naming schemas used over the years. The reason this is important is so that LucidCharts can properly read it and present it correctly. For me, this was a few change requests to ensure things were logically named correctly at the port level. Also, you will need to place proper security controls around the Google sheet since this is what LucidCharts hits.


Step 3 - 

Follow the link/video below on how to link data into LucidCharts. The cool thing is since LucidCharts dynamically updates itself your display will update within a minute.

 https://www.youtube.com/watch?v=EkCJzx7HAAc 


Step 4: 

Ensure you and your team understands that you need to properly document network changes which now includes this new Google Sheet. From my perspective, since physical network changes do not occur very often now that physical lines are properly identified and ports our logically mapped. This is why this works. In addition, if something did need to physically move since everything is already mapped this still works. [At least in this enviorment] Equally, however!!! This is why version 2 is being worked on, who really wants to update a Google Sheet. BTW I did find this link... however I haven't played with the code https://www.reddit.com/r/meraki/comments/c23ral/export_switch_ports_to_csv_using_python/ )


Also here is another helpful link I am looking into ..... now that I know it exists  (doh)

https://developer.cisco.com/codeexchange/github/repo/meraki/automation-scripts/


Let me know if you have more questions. 


- Ed


van604
Getting noticed

thanks for the insight and all the tinkering, gonna give it a try thanks