We're migrating to the Cisco Community on March 29. The Meraki Community will enter read-only mode starting on March 26.
Learn more- Technical Forums
- :
- Developers & APIs
- :
- VPN Latency in via VPN Status but not via Dashboard API
VPN Latency in via VPN Status but not via Dashboard API
Solved- Subscribe to RSS Feed
- Mark Topic as New
- Mark Topic as Read
- Float this Topic for Current User
- Bookmark
- Subscribe
- Mute
- Printer Friendly Page
- Mark as New
- Bookmark
- Subscribe
- Mute
- Subscribe to RSS Feed
- Permalink
- Report Inappropriate Content
VPN Latency in via VPN Status but not via Dashboard API
Under what conditions would VPN latency be visible/listed in the Dashboard via VPN Status but not reported via this endpoint:
https://developer.cisco.com/meraki/api-v1/get-organization-appliance-vpn-stats/
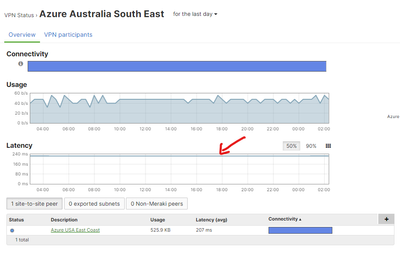
For example, in certain customers I am seeing send/receive data via the API and nothing else (like I would expect to see for a non Auto VPN tunnel), but in the Dashboard UI for VPN Status it shows the Latency in ms for the given tunnel.
Solved! Go to solution.
- Mark as New
- Bookmark
- Subscribe
- Mute
- Subscribe to RSS Feed
- Permalink
- Report Inappropriate Content
Yep, it's frustrating that latency isn't included in an API endpoint (as far as I know), but as I say it is fixable by contacting Meraki support and ask them to enable 'VPN statistics' for the Org
COO
Highlight - Service Observability Platform
www.highlight.net
- Mark as New
- Bookmark
- Subscribe
- Mute
- Subscribe to RSS Feed
- Permalink
- Report Inappropriate Content
- Mark as New
- Bookmark
- Subscribe
- Mute
- Subscribe to RSS Feed
- Permalink
- Report Inappropriate Content
Hi,
Are you talking about this Dashboard latency:
Or this latency dashboard page:
The API call you've mentioned gets stats on the latter, and these Latency, Jitter, Packet Loss and MOS values are there to support the SD-WAN performance based routing functionality and are only collected either if one end of the tunnel has dual uplinks, or you ask support to turn it on if you only have single uplinks.
COO
Highlight - Service Observability Platform
www.highlight.net
- Mark as New
- Bookmark
- Subscribe
- Mute
- Subscribe to RSS Feed
- Permalink
- Report Inappropriate Content
Hi, @MartinS and thanks for your reply. I'm familiar with what you're referring to from the documentation, however the customer shared this screenshot (I blurred out their info) where they show the tunnel latency in the Dashboard UI but the API only returns the send/receive data. I really appreciate you and thanks again.
Below are two screenshots, one from the on-demand Dashboard demo environment and the other from the customer's environment where the latency is shown in the Dashboard UI but not in the API response.

- Mark as New
- Bookmark
- Subscribe
- Mute
- Subscribe to RSS Feed
- Permalink
- Report Inappropriate Content
Yep, it's frustrating that latency isn't included in an API endpoint (as far as I know), but as I say it is fixable by contacting Meraki support and ask them to enable 'VPN statistics' for the Org
COO
Highlight - Service Observability Platform
www.highlight.net
- Mark as New
- Bookmark
- Subscribe
- Mute
- Subscribe to RSS Feed
- Permalink
- Report Inappropriate Content
Hi @Prodrick,
The reason you see this in certain customers vs all of them is based on the number of uplinks used by the MX. The probes that we use to gather this data are automatically turned on when there are two uplinks, we use the probing data to make any policy based routing decisions. You can read further about this here - https://documentation.meraki.com/MX/Monitoring_and_Reporting/SD-WAN_Monitoring
In terms of monitoring a single uplink spoke, you are able to see the statistics for a single uplink peer from the hub side if the hub is multi wan enabled. Alternatively as @MartinS has mentioned, there is some back end configuration. However, we encourage you to reach out to your accounts team as there are some design considerations to keep in mind when enabling it.
-
Bluetooth
3 -
Captive Portal API
11 -
Code Sample
63 -
Dashboard API
376 -
Getting Started
10 -
Other
6 -
Python
13 -
Scanning API
28 -
Updates from Meraki
50 -
Webhooks
19 -
Webinars
6


