We're migrating to the Cisco Community on March 29. The Meraki Community will enter read-only mode starting on March 26.
Learn more- Technical Forums
- :
- Developers & APIs
- :
- Re: Response other than 200 - scanning API
Response other than 200 - scanning API
Solved- Subscribe to RSS Feed
- Mark Topic as New
- Mark Topic as Read
- Float this Topic for Current User
- Bookmark
- Subscribe
- Mute
- Printer Friendly Page
- Mark as New
- Bookmark
- Subscribe
- Mute
- Subscribe to RSS Feed
- Permalink
- Report Inappropriate Content
Response other than 200 - scanning API
Hey everyone. I was following the CMX AWS lambda guide - https://github.com/dexterlabora/cmxreceiver-lambda-inline
It looks like everything is all good on the AWS end. If I copy my post URL into the browser, it returns the correct meraki validation key. However, the URL will not validate. I receive a "Response other than 200". If I check the AWS logs, it looks like the request is never making it to the API gateway. I checked the event logs for my MX64 and OpenDNS to see if the URL was somehow being blocked.
Any recommendations or ideas would really be beneficial.
Solved! Go to solution.
- Mark as New
- Bookmark
- Subscribe
- Mute
- Subscribe to RSS Feed
- Permalink
- Report Inappropriate Content
Thanks for the kind words!
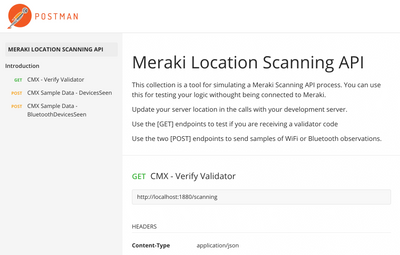
Since I'm not positive on your entire setup, you might find this Postman collection I just wrote helpful for troubleshooting.
It will basically allow you to simulate a Meraki GET and POST request to your AWS server or any other for that matter. Just update the Endpoint address (i.e. localhost:1880) to your instance. I use this all the time while developing on an airplane 😉
https://documenter.getpostman.com/view/897512/71FUpux
First test with the GET request, to see if AWS return your validator key
Then, test with one of the POST requests to send an observation set.
Look into your AWS Cloud Watch logs to see if you get any helpful info.
The AWS permissions are somewhat complicated to get right.
Also, double check your Lambda Trigger settings.
(Here is an example test setup)
Good luck and let us know what you find out.
Cory
- Mark as New
- Bookmark
- Subscribe
- Mute
- Subscribe to RSS Feed
- Permalink
- Report Inappropriate Content
Hey Lee,
I suggest emailing support@meraki.com for some extra help. They'll probably start by asking you to test your URL is valid by pasting it into a web browser.
Here is the documentation on troubleshooting:
Regards,
Colin Lowenberg
- Mark as New
- Bookmark
- Subscribe
- Mute
- Subscribe to RSS Feed
- Permalink
- Report Inappropriate Content
Thanks Colin. I am working with Meraki support right now. They seem to think it's a SSL issue. If I execute the URL in the browser, I get the proper response with the correct validator. I'll keep everyone updated just in case anyone else runs into the same problem.
- Mark as New
- Bookmark
- Subscribe
- Mute
- Subscribe to RSS Feed
- Permalink
- Report Inappropriate Content
Let me know if you find any issues with the AWS lambda code. I wrote the NodeJS receiver code section a year ago and I'm happy to update something if it proves to be the problem child.
https://github.com/dexterlabora/cmxreceiver-lambda-inline/blob/master/src/cmx-lambda-inline.js
Cheers,
Cory
- Mark as New
- Bookmark
- Subscribe
- Mute
- Subscribe to RSS Feed
- Permalink
- Report Inappropriate Content
Cory! You're awesome. I was actually considering emailing you, but thought "Nah, he probably won't respond".
First, I love your tutorial. I'm not a developer by trade, but I understand coding. It was very easy to follow. I've been working with Meraki support but it looks like they are kind of blowing me off and telling me to talk to AWS support. All my API gateway logs in AWS are showing that when I execute the URL from the browser, it returns code 200 and the correct validation key. When I execute the URL from the Meraki Dashboard, there is nothing happening on the AWS side. No log created. No API call to the gateway. I'm guessing that means the problem is from the Meraki cloud to the AWS API gateway. It's hard to tell since nothing is being logged on the AWS side.
- Mark as New
- Bookmark
- Subscribe
- Mute
- Subscribe to RSS Feed
- Permalink
- Report Inappropriate Content
Thanks for the kind words!
Since I'm not positive on your entire setup, you might find this Postman collection I just wrote helpful for troubleshooting.
It will basically allow you to simulate a Meraki GET and POST request to your AWS server or any other for that matter. Just update the Endpoint address (i.e. localhost:1880) to your instance. I use this all the time while developing on an airplane 😉
https://documenter.getpostman.com/view/897512/71FUpux
First test with the GET request, to see if AWS return your validator key
Then, test with one of the POST requests to send an observation set.
Look into your AWS Cloud Watch logs to see if you get any helpful info.
The AWS permissions are somewhat complicated to get right.
Also, double check your Lambda Trigger settings.
(Here is an example test setup)
Good luck and let us know what you find out.
Cory
- Mark as New
- Bookmark
- Subscribe
- Mute
- Subscribe to RSS Feed
- Permalink
- Report Inappropriate Content
Thanks Cory. I got it working. The data is being posted into DynamoDB. The ES with Kibana is a pain and I'm still working through that, but I'm happy I'm collecting the data! Thanks again
- Mark as New
- Bookmark
- Subscribe
- Mute
- Subscribe to RSS Feed
- Permalink
- Report Inappropriate Content
I had same problem, and I found one workaround to use "HTTP" request to AWS API gateway.
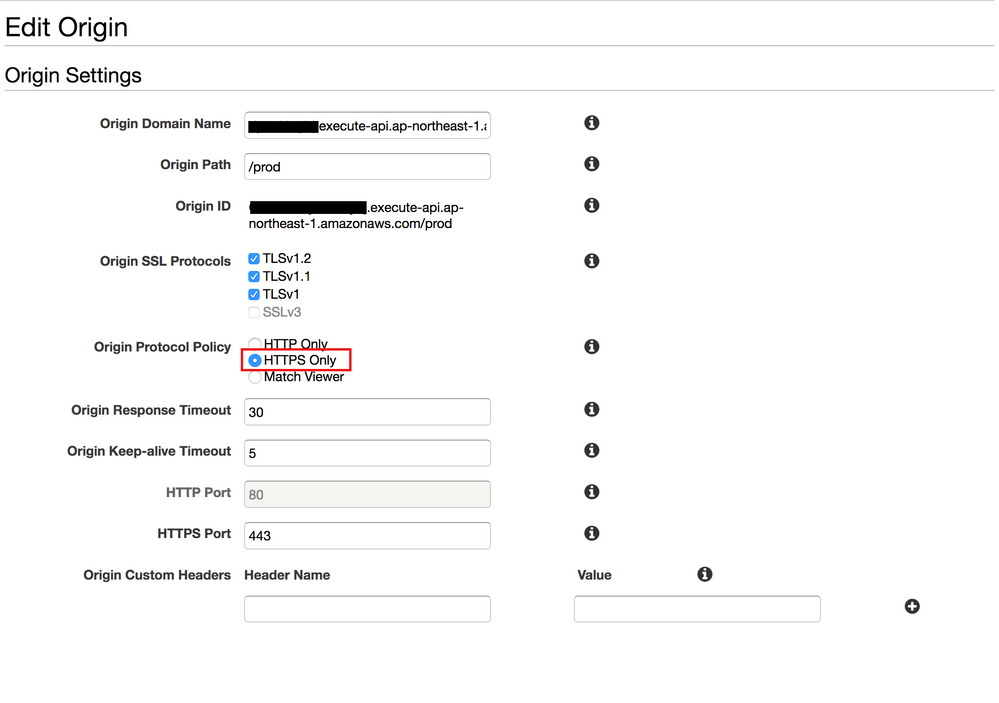
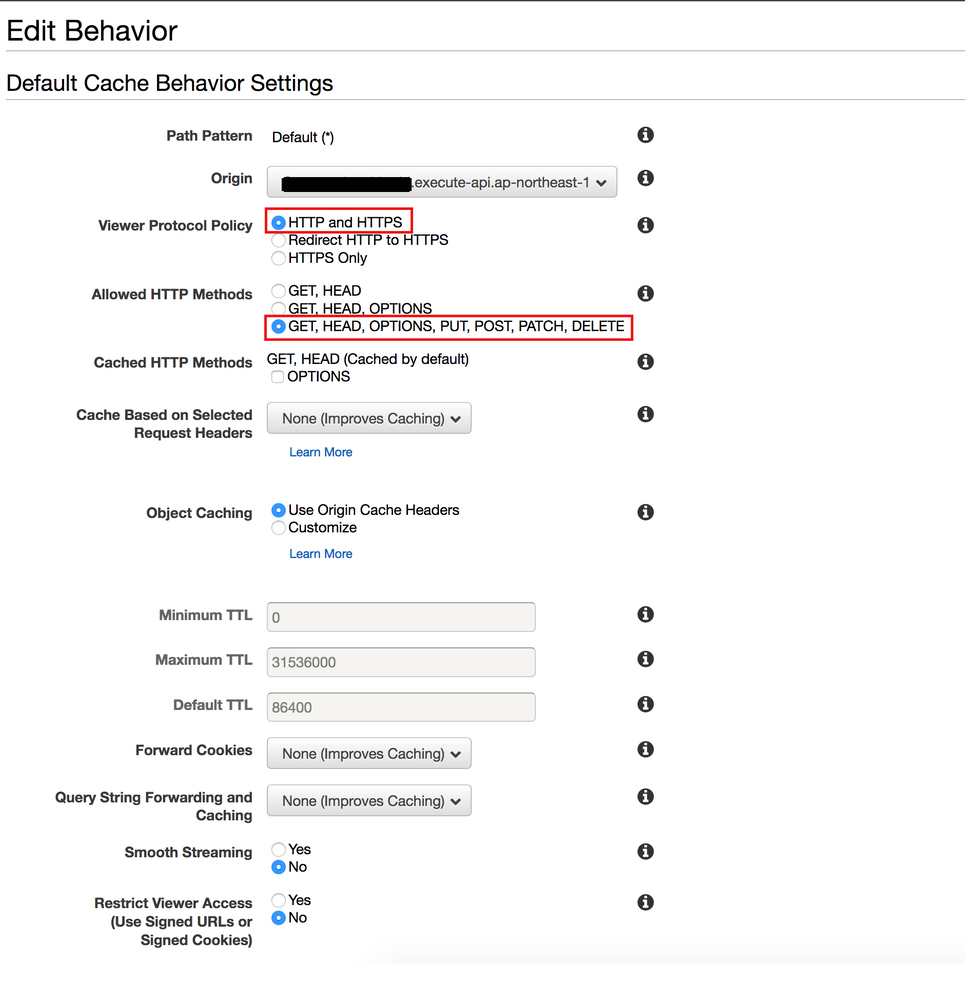
AWS API gateway is normally working only with HTTPS, so I place AWS CloudFront to use HTTP method on front side to the Meraki Cloud.
Meraki Cloud > (http) > CloudFront > (https) > API Gateway/Lambda/DynamoDB
Here is configuration example of CloudFront.


- Mark as New
- Bookmark
- Subscribe
- Mute
- Subscribe to RSS Feed
- Permalink
- Report Inappropriate Content
Thank you for useful information.
I have the same problem. I have tried to apply your workaround, but the problem has not been solved. Should the 'Post URL' on Meraki dashboard start with 'http', or 'https' ? Do we need to change configuration on API gateway?
Any comment would be helpful.
- Mark as New
- Bookmark
- Subscribe
- Mute
- Subscribe to RSS Feed
- Permalink
- Report Inappropriate Content
In my configuration, Meraki dashboard 'Post URL' start with "http", not using "https", and no change at API Gateway.
Here is URL/Domain examples in this case.
API Gateway URL: https://xxxxx.execute-api.ap-northeast-1.amazonaws.com/prod/cmxreceiver-dynamodb
CloudFront Origin: xxxxx.execute-api.ap-northeast-1.amazonaws.com/prod
CloudFront Domain: yyyyy.cloudfront.net
Meraki dashboard Post URL: http://yyyyy.cloudfront.net/cmxreceiver-dynamodb
- Mark as New
- Bookmark
- Subscribe
- Mute
- Subscribe to RSS Feed
- Permalink
- Report Inappropriate Content
That's what I wanted to know. It worked!!
Thank you very much!
- Mark as New
- Bookmark
- Subscribe
- Mute
- Subscribe to RSS Feed
- Permalink
- Report Inappropriate Content
Can you share how did you get it to work?
I have the same issue: Getting "Response other than 200" when validating my URL on AWS API Gateway from Meraki.
But if I call my URL via postman or browser, I'm getting the right validator back and response 200.
(I also used the tested from postman collection from Cory and it also worked)
From AWS log, it appears nothing has reached AWS at all. It seems like an connection issue from Meraki cloud.
I have also tried setting up a Cloud front to API Gateway via a http call from Meraki as suggested from other users on this post, but still getting the same error.
Any help is appreciated.
Regards,
Lawrence
- Mark as New
- Bookmark
- Subscribe
- Mute
- Subscribe to RSS Feed
- Permalink
- Report Inappropriate Content
Update: I got this to work now, by changing the API endpoint type from "Edge Optimized" to "Regional".
Have kept https in Meraki post URL to call API gateway directly.
- Mark as New
- Bookmark
- Subscribe
- Mute
- Subscribe to RSS Feed
- Permalink
- Report Inappropriate Content
Oh man. I did the jerk IT thing. Ask for help and then never respond when I figured out the resolution. Sorry about that. I'm glad you got it to work. I actually shut it back down for a few reasons.
1. I'm not an AWS expert, but man... Security controls are a nightmare. I got it to work by basically turning off as many security measures as I could and granting everything permission. If you know AWS, then it is pretty awesome, but personally, I'm no expert. I can't remember the exact solution, but I think I read a blog post somewhere explaining the regional thing and that did the trick.
2. I wasn't exactly sure what to do with the data that the built in location analytics didn't already do. I guess longer retention rate? I can see this being useful if you were also pulling analytics into the same database from other things and pairing them with the Meraki data. Any other sample use cases would be welcome. This was a great tutorial.
3. Elastisearch is expensive.
Sorry about the late response!
- Mark as New
- Bookmark
- Subscribe
- Mute
- Subscribe to RSS Feed
- Permalink
- Report Inappropriate Content
2. You can re-create the Meraki dashboard's analytics - but generally the use case is to go further into the data and combine it with other data. You get the real MAC address with the API and you can locate a specific user and link them to Syslog alerts/events, captive portal data with social media / email / SMS / loyalty programs. The best use without extra data sets would be simply ranking all of your sites and identifying trends like a stock ticker showing the increase in traffic over the last day, week, month. Meraki dashboard only let's you compare 2 networks or 2 network-tags or 2 AP-tags. If you want to get your top 10 gains and top 10 losses, like a stock tracker, that would need something like elastic search.
- Mark as New
- Bookmark
- Subscribe
- Mute
- Subscribe to RSS Feed
- Permalink
- Report Inappropriate Content
1. When I was building this integration, I got tripped up on the permissions also, so you are not alone!
2. The purpose is to capture the raw data (i.e MAC addresses) to use as desired. The Meraki built-it reporting anonymizes the data and has a limited amount of reports. By collecting this data, you can trigger workflows for known clients, aggregate the data with other sources and analyze multiple networks as needed.
(Glad you liked the tutorial 😉 We hope to build many more tutorials like this for our developers and integrators.
3. As an alternative to Elasticsearch and AWS, I have also written a basic Google Firebase Database version.
It will provide a Firebase Function to run the CMX/Scanning API receiver. That data is then stored in the Firebase Database, by MAC address. The service is FREE. To get a solution similar to Elasticsearch, you could integrate Google Big Query, but there is a cost associated with that.
https://github.com/dexterlabora/MerakiLocationFirebase
- Mark as New
- Bookmark
- Subscribe
- Mute
- Subscribe to RSS Feed
- Permalink
- Report Inappropriate Content
No worries~ Thanks for sharing your experience~
-
Bluetooth
3 -
Captive Portal API
11 -
Code Sample
63 -
Dashboard API
376 -
Getting Started
10 -
Other
6 -
Python
13 -
Scanning API
28 -
Updates from Meraki
50 -
Webhooks
19 -
Webinars
6


