We're migrating to the Cisco Community on March 31. The Meraki Community will enter read-only mode starting on March 26 through March 31.
Learn more- Technical Forums
- :
- Developers & APIs
- :
- Re: Dashboard Webhooks to Splunk
Dashboard Webhooks to Splunk
- Subscribe to RSS Feed
- Mark Topic as New
- Mark Topic as Read
- Float this Topic for Current User
- Bookmark
- Subscribe
- Mute
- Printer Friendly Page
- Mark as New
- Bookmark
- Subscribe
- Mute
- Subscribe to RSS Feed
- Permalink
- Report Inappropriate Content
Dashboard Webhooks to Splunk
I had a customer request to send alert webhooks into Splunk.
Couldn't find it documented, nor on this forum or Splunk's site, and searching only turned up a few people asking how to do it, I gave up and figured it out.
To save time if you ever need to do it...
Make sure Early API Access is enabled on the organization, this activates the "Add or edit webhook templates" feature on the Network-wide->Alerts page.
To start with, create a new template (I suggest start by copying the Meraki one), then edit it to add a Liquid header with this key...
Authorization
...and value...
Splunk {{ sharedSecret }}
...note that there's a space after Splunk.
Click 'generate preview' and you'll see...
{
  "Authorization": "Splunk "
}
- Mark as New
- Bookmark
- Subscribe
- Mute
- Subscribe to RSS Feed
- Permalink
- Report Inappropriate Content
Thanks @sungod for posting your solution. I'm glad you found the webhook templates, because this is exactly what they were made for.
I started writing a template for Splunk, but did not have a test environment to verify. Here is what I have created so far, but I would love some validation. This can then be shared on our github repo containing all of our open source webhook templates.
Headers template
{
  "Authorization": "Splunk {{sharedSecret}}",
  "X-Splunk-Request-Channel":	"XXXXXX"
}
Body template
{
  "time":{{sentAt | date:"%s"}},
  "host": "api.meraki.com",
  "source": "{{networkName}}",
  "sourceType":"main",
  "event" : {
    "sentAt": "{{sentAt}}",
    "organizationId": "{{organizationId}}",
    "organizationName": "{{organizationName}}",
    "organizationUrl": "{{organizationUrl}}",
    "networkId": "{{networkId}}",
    "networkName": "{{networkName}}",
    "networkUrl": "{{networkUrl}}",
    "networkTags": {{ networkTags | jsonify }},
    "deviceSerial": "{{deviceSerial}}",
    "deviceMac": "{{deviceMac}}",
    "deviceName": "{{deviceName}}",
    "deviceUrl": "{{deviceUrl}}",
    "deviceTags": {{ deviceTags | jsonify }},
    "deviceModel": "{{deviceModel}}",
    "alertId": "{{alertId}}",
    "alertType": "{{alertType}}",
    "alertTypeId": "{{alertTypeId}}",
    "alertLevel": "{{alertLevel}}",
    "occurredAt": "{{occurredAt}}",
    "alertData": {{ alertData | jsonify }}
  }
}
- Mark as New
- Bookmark
- Subscribe
- Mute
- Subscribe to RSS Feed
- Permalink
- Report Inappropriate Content
Hi,
I don't have a test system either, am reliant on the customer checking things at their end, I'd used https://webhook.site/ as a test receiver to get things to point I was ready to test with the customer.
As well as the header I used, they asked for some specific elements in the body, I don't think these are mandatory, just reflect the way they've set up Splunk for the various things they use it for. My guess is Splunk is so configurable that the body will often need adapting.
{
"index":"an ID the customer wanted",
"source":"another ID the customer wanted",
"sourcetype":"here they wanted Cisco-Meraki",
"event":{
#in here I simply used the default Meraki template
}}
- Mark as New
- Bookmark
- Subscribe
- Mute
- Subscribe to RSS Feed
- Permalink
- Report Inappropriate Content
Okay, same here. Let us know how the testing goes. There were a lot of options, so I am curious what the end-to-end solution and experience looks like. Send a screenshot of the final message in Splunk if you can (hide any sensitive info obviously).
Thanks!
- Mark as New
- Bookmark
- Subscribe
- Mute
- Subscribe to RSS Feed
- Permalink
- Report Inappropriate Content
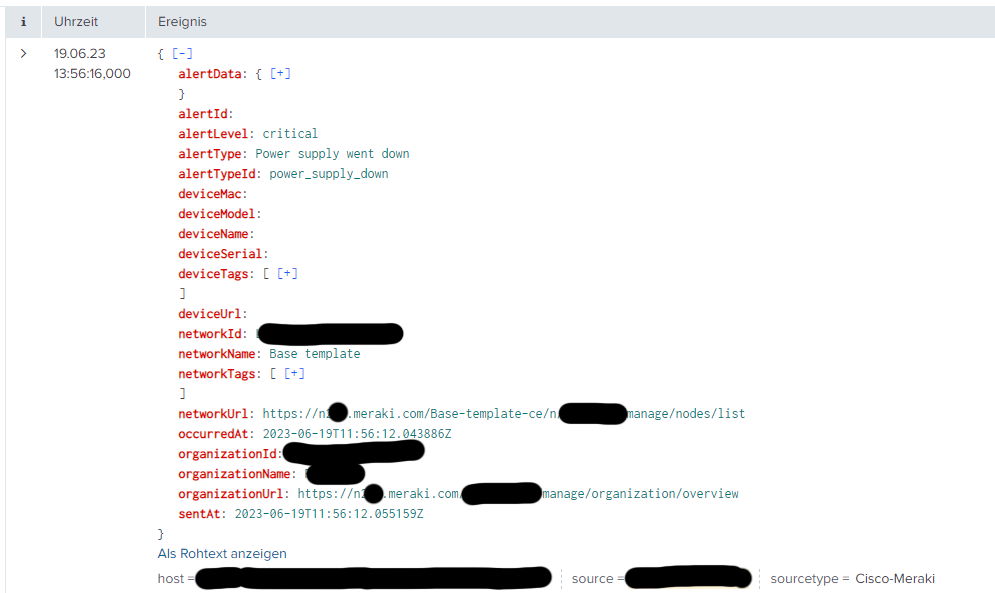
I had a screenshot from the testing, it's not very exciting, Splunk is showing all the fields ok, same as I saw them using the test receiver, though they are shown alphabetically sorted by Splunk.
Once we go live I think they may want to refine the body, but that's probably customer specific rather than to do with Splunk.
- Mark as New
- Bookmark
- Subscribe
- Mute
- Subscribe to RSS Feed
- Permalink
- Report Inappropriate Content
Hey, i created a custom template, used the same config for the header and the body without using the below line
"X-Splunk-Request-Channel": "XXXXXX"
and when i test the webhook it fails. i am not sure why it fails
in the liquid header i added the following
Key : Authorization
value: Splunk {{sharedSecret}}
and in the liquid body i used
{
  "time":{{sentAt | date:"%s"}},
  "host": "api.meraki.com",
  "source": "{{networkName}}",
  "sourceType":"main",
  "event" : {
    "sentAt": "{{sentAt}}",
    "organizationId": "{{organizationId}}",
    "organizationName": "{{organizationName}}",
    "organizationUrl": "{{organizationUrl}}",
    "networkId": "{{networkId}}",
    "networkName": "{{networkName}}",
    "networkUrl": "{{networkUrl}}",
    "networkTags": {{ networkTags | jsonify }},
    "deviceSerial": "{{deviceSerial}}",
    "deviceMac": "{{deviceMac}}",
    "deviceName": "{{deviceName}}",
    "deviceUrl": "{{deviceUrl}}",
    "deviceTags": {{ deviceTags | jsonify }},
    "deviceModel": "{{deviceModel}}",
    "alertId": "{{alertId}}",
    "alertType": "{{alertType}}",
    "alertTypeId": "{{alertTypeId}}",
    "alertLevel": "{{alertLevel}}",
    "occurredAt": "{{occurredAt}}",
    "alertData": {{ alertData | jsonify }}
  }
}
then at the receiver section i added the url, the token under the shared secret and selected the template i just created.
- Mark as New
- Bookmark
- Subscribe
- Mute
- Subscribe to RSS Feed
- Permalink
- Report Inappropriate Content
I suggest use https://webhook.site/ to check your request headers and body.
Splunk itself needs to be set up to accept the webhook, is there any logging that end to show what is happening?
-
Bluetooth
3 -
Captive Portal API
11 -
Code Sample
63 -
Dashboard API
376 -
Getting Started
10 -
Other
6 -
Python
13 -
Scanning API
28 -
Updates from Meraki
50 -
Webhooks
19 -
Webinars
6

