We're migrating to the Cisco Community on March 29. The Meraki Community will enter read-only mode starting on March 26.
Learn more- Technical Forums
- :
- Dashboard & Administration
- :
- Re: Summary report , usage %
Summary report , usage %
Solved- Subscribe to RSS Feed
- Mark Topic as New
- Mark Topic as Read
- Float this Topic for Current User
- Bookmark
- Subscribe
- Mute
- Printer Friendly Page
- Mark as New
- Bookmark
- Subscribe
- Mute
- Subscribe to RSS Feed
- Permalink
- Report Inappropriate Content
Summary report , usage %
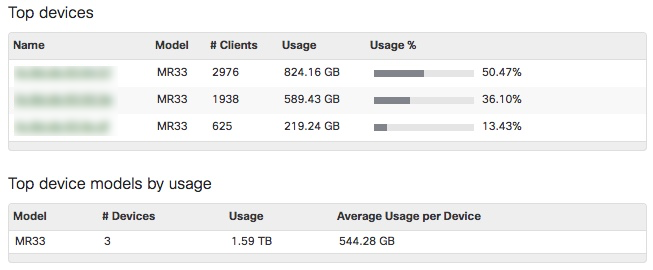
in the summary report, in the top device section, we see the usage and the usage %. Does anybody know against what value the % is calculated ?
Solved! Go to solution.
- Mark as New
- Bookmark
- Subscribe
- Mute
- Subscribe to RSS Feed
- Permalink
- Report Inappropriate Content
You're seeing the usage of a single client against the usage of all clients that match the current filter criteria for the summary report.
Here's a sample from a smaller network where you can do the math by hand. If I change the filter to show a single network or use a different date range, both the percentages and totals change as you would expect.
-
Administrators
243 -
Change log
15 -
Firmware upgrades
32 -
Inventory
49 -
Licensing
82 -
Meraki mobile app
13 -
Other
180

