- Technical Forums
- :
- Dashboard & Administration
- :
- Re: Certain alerts do not trigger the ''alerting'' status in the Dashboard
Certain alerts do not trigger the ''alerting'' status in the Dashboard
- Subscribe to RSS Feed
- Mark Topic as New
- Mark Topic as Read
- Float this Topic for Current User
- Bookmark
- Subscribe
- Mute
- Printer Friendly Page
- Mark as New
- Bookmark
- Subscribe
- Mute
- Subscribe to RSS Feed
- Permalink
- Report Inappropriate Content
Certain alerts do not trigger the ''alerting'' status in the Dashboard
Hi ,
I have been experiencing some issues to properly identify Networks and devices that are alerting.
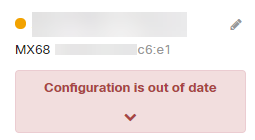
For example , I have a device that is in the "Configuration is out of date" state for months but the Overview -> Devices page doesn't display the device as alerting. When going to the network Appliance Status OR via API ( {0}/organizations/{1}/devices/statuses ) it correctly identify the device as ''alerting'' :
Appliance status page :
Org -> Overview -> Device page
I think that the events ''Configuration is out of date'' and ''Unable to fetch config" are the 2 states that do not trigger in the Overview Page , which is a bit odd to me.
Has anyone experienced this before ? I'm about to open as case to see if it's a bug or not.
Thanks ,
- Labels:
-
Administrators
-
Change log
-
Other
- Mark as New
- Bookmark
- Subscribe
- Mute
- Subscribe to RSS Feed
- Permalink
- Report Inappropriate Content
If it's been an issue for months, it could be a problem with the device's DNS or upstream firewall rules. Alert is basically telling you the device is having problems reaching the dashboard, but isn't necessarily affecting end users. Might be why it's not considered serious enough to show up as alerting on other pages, which it really should.
Documentation on these alerts available at this page:
- Mark as New
- Bookmark
- Subscribe
- Mute
- Subscribe to RSS Feed
- Permalink
- Report Inappropriate Content
It really should !
Just found out that "Recent 802.1X Failure" and "This switch's current stack members differ from the dashboard configuration" alerts are also affecting MS Switches.
It is odd enough. I will open a case.
- Mark as New
- Bookmark
- Subscribe
- Mute
- Subscribe to RSS Feed
- Permalink
- Report Inappropriate Content
@RaphaelL I think the configuration is out of date need to have some form of timer before it shows an alert because seeing an error briefly each time you make a change would annoy me and would be like the boy who cried wolf.
- Mark as New
- Bookmark
- Subscribe
- Mute
- Subscribe to RSS Feed
- Permalink
- Report Inappropriate Content
@BlakeRichardson I totatly agree with you ! In my case a device has been reporting ''Config is out of date'' for more than 3 weeks ! I would have like to be informed of that issue way earlier than randomly coming across it.
- Mark as New
- Bookmark
- Subscribe
- Mute
- Subscribe to RSS Feed
- Permalink
- Report Inappropriate Content
I'm not aware of any alert for this, and this issue can usually only be resolved by Meraki support.
- Mark as New
- Bookmark
- Subscribe
- Mute
- Subscribe to RSS Feed
- Permalink
- Report Inappropriate Content
I have over 5000 networks in that Org and I like to be able to go to Overview -> Networks / Devices to see if there is any issues.
I know that when using the API it returns me the correct number of devices that are ''alerting''. The dashboard isn't.
I'm not refering to alerts from network-wide -> Alerts page to send alerts when ''X'' event is happening.
I did open a ticket and I have a strong feeling that the TAC will suggest a feature request, which to me is absurd considering that the API returns the info ,you just have to display it correctly in the dashboard. Anyway, to be continued.
-
Administrators
177 -
Android
1 -
Change log
9 -
Firmware Upgrades
26 -
Inventory
44 -
Licensing
59 -
Other
133 -
Security & SD-WAN (MX)
1


