- Technical Forums
- :
- Wireless
- :
- Application details
Application details
- Subscribe to RSS Feed
- Mark Topic as New
- Mark Topic as Read
- Float this Topic for Current User
- Bookmark
- Subscribe
- Mute
- Printer Friendly Page
- Mark as New
- Bookmark
- Subscribe
- Mute
- Subscribe to RSS Feed
- Permalink
- Report Inappropriate Content
Application details
Application details is there a way to print them out from dashboard?
- Mark as New
- Bookmark
- Subscribe
- Mute
- Subscribe to RSS Feed
- Permalink
- Report Inappropriate Content
https://dashboard.meraki.com/api_docs#the-traffic-analysis-data-for-this-network
SAMPLE REQUEST
curl -L -H 'X-Cisco-Meraki-API-Key: <key>' -H 'Content-Type: application/json' -X GET 'https://api.meraki.com/api/v0/networks/{networkId}/traffic'
SAMPLE RESPONSE
Successful HTTP Status: 200

[
  {
    "application": "Gmail",
    "destination": null,
    "protocol": "TCP",
    "port": 443,
    "sent": 138.0,
    "recv": 61.0,
    "numClients": 7,
    "activeTime": 77000,
    "flows": 300
  }
]
- Mark as New
- Bookmark
- Subscribe
- Mute
- Subscribe to RSS Feed
- Permalink
- Report Inappropriate Content
I'm assuming you're talking about the pie chart data in the Network-wide > Clients. There's no easy way to print that I think.
But take a look at the data on the Network-wide > Traffic Analytics page. You can download that data as .csv. There are subtle differences between the data shown in both but it may prove useful for you nontheless.
- Mark as New
- Bookmark
- Subscribe
- Mute
- Subscribe to RSS Feed
- Permalink
- Report Inappropriate Content
@BrechtSchamp wrote:I'm assuming you're talking about the pie chart data in the Network-wide > Clients. There's no easy way to print that I think.
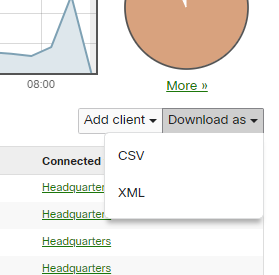
Top right of the table:
- Mark as New
- Bookmark
- Subscribe
- Mute
- Subscribe to RSS Feed
- Permalink
- Report Inappropriate Content
@jdsilva wrote:
@BrechtSchamp wrote:I'm assuming you're talking about the pie chart data in the Network-wide > Clients. There's no easy way to print that I think.
Top right of the table:
@jdsilva Isn't that the client details from the table below?
- Mark as New
- Bookmark
- Subscribe
- Mute
- Subscribe to RSS Feed
- Permalink
- Report Inappropriate Content
Oh, yes. Whoops. You're right @BrechtSchamp . I'm not reading everything properly again 😞


