We're migrating to the Cisco Community on March 29. The Meraki Community will enter read-only mode starting on March 26.
Learn more- Technical Forums
- :
- Wireless
- :
- Re: AP Client Count History
AP Client Count History
Solved- Subscribe to RSS Feed
- Mark Topic as New
- Mark Topic as Read
- Float this Topic for Current User
- Bookmark
- Subscribe
- Mute
- Printer Friendly Page
- Mark as New
- Bookmark
- Subscribe
- Mute
- Subscribe to RSS Feed
- Permalink
- Report Inappropriate Content
AP Client Count History
Can someone tell me how I can view the client count on an AP. It used to be so easy and now I can't find it.
Solved! Go to solution.
- Mark as New
- Bookmark
- Subscribe
- Mute
- Subscribe to RSS Feed
- Permalink
- Report Inappropriate Content
Yeah I just googled you and found your org 😉
It has this banner on the performance tab
- Mark as New
- Bookmark
- Subscribe
- Mute
- Subscribe to RSS Feed
- Permalink
- Report Inappropriate Content
Nothing has changed. From the AP summary page enable one of the client columns. Or, in any AP detail page the current clients show near the top. Clients over time show at the bottom of the page.
- Mark as New
- Bookmark
- Subscribe
- Mute
- Subscribe to RSS Feed
- Permalink
- Report Inappropriate Content
Your option 1 is 'currently connected' clients
Your option 2 is also current clients or total for the last 24 hours.
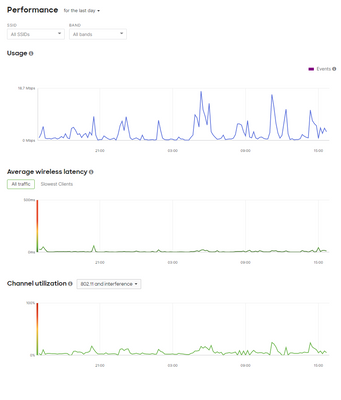
There used to be a way I could see how many clients connected over time. Like I could click an AP and check the RF tab and see that at 2pm there was a big meeting because say 80 clients connected to the AP, meeting ended at 3pm and the client count went back down to 10. It was a graph/chart format. I can't find that anymore.
- Mark as New
- Bookmark
- Subscribe
- Mute
- Subscribe to RSS Feed
- Permalink
- Report Inappropriate Content
Performance tab? That was implemented a half year ago maybe. Don't recall exactly when.
- Mark as New
- Bookmark
- Subscribe
- Mute
- Subscribe to RSS Feed
- Permalink
- Report Inappropriate Content
- Mark as New
- Bookmark
- Subscribe
- Mute
- Subscribe to RSS Feed
- Permalink
- Report Inappropriate Content
I know it used to exist cause I would reference it from time to time, so I just assumed it was moved somewhere else but I'm at a loss as to where.
- Mark as New
- Bookmark
- Subscribe
- Mute
- Subscribe to RSS Feed
- Permalink
- Report Inappropriate Content
It's present on my network and every network I've checked. I'd say open a Support case and see if they explain why it's not visible for you.
- Mark as New
- Bookmark
- Subscribe
- Mute
- Subscribe to RSS Feed
- Permalink
- Report Inappropriate Content
I think I might know why. What firmware version are you running?
I have another site with 27.7.1 and I can see it there.
This site I have is 26.8.3 and its not showing, and its an MR32 so I can't go any higher.
I really hope someone up top didn't remove this and tie it to firmware versions. It's been around since forever, ugh.
- Mark as New
- Bookmark
- Subscribe
- Mute
- Subscribe to RSS Feed
- Permalink
- Report Inappropriate Content
Yeah I just googled you and found your org 😉
It has this banner on the performance tab
- Mark as New
- Bookmark
- Subscribe
- Mute
- Subscribe to RSS Feed
- Permalink
- Report Inappropriate Content
Crap >.<
I'm sure I closed out that a banner a long time ago since I see them so often. Not sure if there is a place to reference those.
Anyhow, it looks like someone up top made an executive decision to take away features from the older models and only allow new models to have them. Deliberate or not, its lame. They are supposed to improve and enhance, not make it worse lol.
Oh well, mystery solved, nothing I can do about it.
Thanks for helping @Ryan_Miles
- Mark as New
- Bookmark
- Subscribe
- Mute
- Subscribe to RSS Feed
- Permalink
- Report Inappropriate Content
Looks like this doc mentions it or at least sorta alludes to it. Time to get your Meraki team involved to upgrade the APs.
I don't spend much time with legacy APs anymore and didn't realize some of those graphs aren't available 😞


