We're migrating to the Cisco Community on March 29. The Meraki Community will enter read-only mode starting on March 26.
Learn more- Technical Forums
- :
- Switching
- :
- Meraki MS - STP
Meraki MS - STP
Solved- Subscribe to RSS Feed
- Mark Topic as New
- Mark Topic as Read
- Float this Topic for Current User
- Bookmark
- Subscribe
- Mute
- Printer Friendly Page
- Mark as New
- Bookmark
- Subscribe
- Mute
- Subscribe to RSS Feed
- Permalink
- Report Inappropriate Content
Meraki MS - STP
Hello Experts,
What is the API to get the RSTP state of switch ports and where can I see it in the dashboard?
I want to see if the interface is in a blocking state or a forwarding state.
-Pavan
Solved! Go to solution.
- Labels:
-
Interfaces
-
Layer 2
- Mark as New
- Bookmark
- Subscribe
- Mute
- Subscribe to RSS Feed
- Permalink
- Report Inappropriate Content
An orange port like that one will show up as a 'error' or 'warning' :
{"portId":"13","enabled":true,"status":"Connected","isUplink":false,"errors":[],"warnings":["BPDU guard activated, STP discarding packets"],"speed":"100 Mbps","duplex":"full","usageInKb"https://api.meraki.com/api/v1/devices/{'serial'}/switch/ports/statuses
I have to "thank" my users for that example... haha
- Mark as New
- Bookmark
- Subscribe
- Mute
- Subscribe to RSS Feed
- Permalink
- Report Inappropriate Content
Have you checked this one?
https://developer.cisco.com/meraki/api/get-network-switch-stp/
Please, if this post was useful, leave your kudos and mark it as solved.
- Mark as New
- Bookmark
- Subscribe
- Mute
- Subscribe to RSS Feed
- Permalink
- Report Inappropriate Content
It would be : https://developer.cisco.com/meraki/api-v1/get-device-switch-ports-statuses/
You would see the port status
- Mark as New
- Bookmark
- Subscribe
- Mute
- Subscribe to RSS Feed
- Permalink
- Report Inappropriate Content
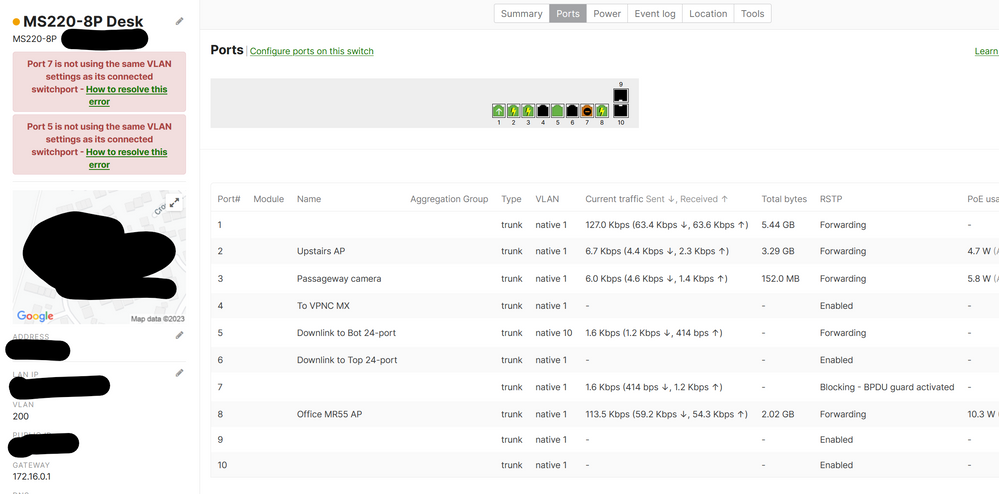
I don't believe either of these calls will provide RSTP status. I'm not aware of an endpoint that provides this, actually. In the Dashboard UI, take a look at port 7 on this screenshot
- Mark as New
- Bookmark
- Subscribe
- Mute
- Subscribe to RSS Feed
- Permalink
- Report Inappropriate Content
An orange port like that one will show up as a 'error' or 'warning' :
{"portId":"13","enabled":true,"status":"Connected","isUplink":false,"errors":[],"warnings":["BPDU guard activated, STP discarding packets"],"speed":"100 Mbps","duplex":"full","usageInKb"https://api.meraki.com/api/v1/devices/{'serial'}/switch/ports/statuses
I have to "thank" my users for that example... haha
- Mark as New
- Bookmark
- Subscribe
- Mute
- Subscribe to RSS Feed
- Permalink
- Report Inappropriate Content
- Mark as New
- Bookmark
- Subscribe
- Mute
- Subscribe to RSS Feed
- Permalink
- Report Inappropriate Content
Hello @RaphaelL
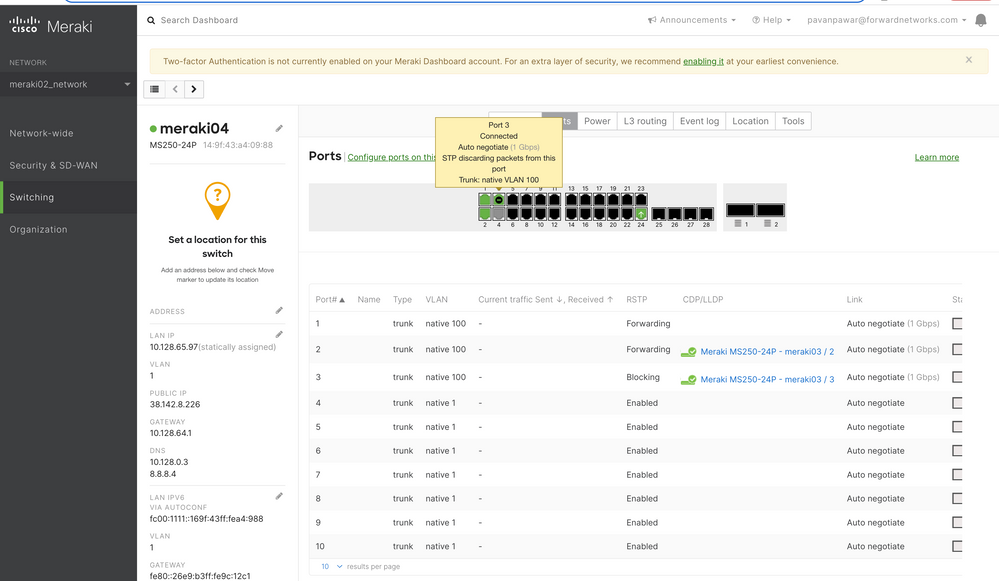
On the UI, Interface 3 shows blocking though the API response shows 'Connected'.
- Mark as New
- Bookmark
- Subscribe
- Mute
- Subscribe to RSS Feed
- Permalink
- Report Inappropriate Content
That's because Meraki thinks that it is a normal condition. You probably don't have BPDU guard on that port , hence you don't have any warnings.
In that case , I don't think you will be able to spot those via the API.
- Mark as New
- Bookmark
- Subscribe
- Mute
- Subscribe to RSS Feed
- Permalink
- Report Inappropriate Content

