Get answers from our community of experts in record time.
Join now- Technical Forums
- :
- Switching
- :
- Re: Introducing SFP Optic Health Monitoring with Digital Optical Monitoring...
Introducing SFP Optic Health Monitoring with Digital Optical Monitoring (DOM)
- Subscribe to RSS Feed
- Mark Topic as New
- Mark Topic as Read
- Float this Topic for Current User
- Bookmark
- Subscribe
- Mute
- Printer Friendly Page
- Mark as New
- Bookmark
- Subscribe
- Mute
- Subscribe to RSS Feed
- Permalink
- Report Inappropriate Content
Introducing SFP Optic Health Monitoring with Digital Optical Monitoring (DOM)
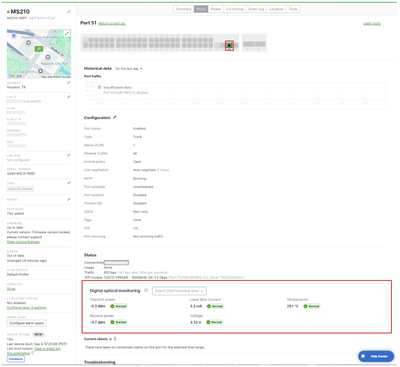
Being able to monitor the health of your fiber optic transceivers in real time is critical for maintaining network reliability and efficient troubleshooting. If you haven't heard about this yet, we are excited to announce a new feature that provides enhanced visibility into the monitoring data of SFP(Small Form-factor Pluggable) fiber optic transceiver parameters such as optical power (input and output), temperature, current, and voltage directly on your switching port details tab.
With this capability, you will be able to:
- Monitor and troubleshoot Meraki SFP optics in real-time
- Receive alerts on the dashboard when parameters exceed set thresholds
- View historical data for each DOM parameter, enabling you to troubleshoot issues more effectively and identify when network failures occurred
For more information on how to set up and use DOM, please visit our documentation. Update to MS17 now to unlock more useful tools and capabilities! Check out this community post for more information.
When you upgrade your network to MS17, head over to Switching -> Switches -> Select a Switch -> Ports Tab to locate this feature.
Unlock More Switching Visibility with Integrated Environmental Sensor Data
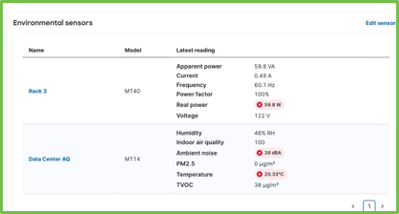
Did you know you can now monitor your switch environment directly from the switching overview page? We have recently added an option for you to integrate and select your MT environmental sensor visibility right into this page. This integrated visibility allows for real-time condition monitoring and provides environmental context to help you proactively monitor and troubleshoot faster. You can access information such as power, temperature, or water sensor data, set customizable threshold alerts, and enable smart automation. Simply navigate to the switching overview page to add your environmental sensor visibility.
Please note, there is no firmware dependency for adding environmental sensor data to the switching overview page. Refer to this documentation for setup instructions.
We would love to hear from you
Please leverage the feedback button on the switching page and let us know your thoughts!
- Labels:
-
Other
- Mark as New
- Bookmark
- Subscribe
- Mute
- Subscribe to RSS Feed
- Permalink
- Report Inappropriate Content
Update to MS17 beta now to unlock more useful tools and capabilities! Check out this community post for more information.
Although MS17 is no longer in beta. It has reach Stable RC
- Mark as New
- Bookmark
- Subscribe
- Mute
- Subscribe to RSS Feed
- Permalink
- Report Inappropriate Content
Good catch. Thanks for flagging.
- Mark as New
- Bookmark
- Subscribe
- Mute
- Subscribe to RSS Feed
- Permalink
- Report Inappropriate Content
I have an MS210-24P on my own network and have upgraded to MS 17.1.2 but I'm missing some of the new features.
- Scheduled pcaps
- Switch health tab
Have these been delayed for a future sub version?
- Mark as New
- Bookmark
- Subscribe
- Mute
- Subscribe to RSS Feed
- Permalink
- Report Inappropriate Content
Neither of these are available yet
- Mark as New
- Bookmark
- Subscribe
- Mute
- Subscribe to RSS Feed
- Permalink
- Report Inappropriate Content
Switch: MS130-8X
If nothing changes I wouldn't be upset, but given a choice, I would like to see one of the following changes.
1. Keep the "current" readings as they are but make the graph a single graph with overlapping variables. Then allow the admin the option to toggle on and off the categories they would like to see on the graph. Doing this would save from "me" from a lot of scrolling if I want to see 3 or more categories.
2. The popup box that is shown when you hover over a plot point would be nice to have if you hover or click the "current" status category, at least the min and and max readings.


