We're migrating to the Cisco Community on March 31. The Meraki Community will enter read-only mode starting on March 26 through March 31.
Learn more- Technical Forums
- :
- Switching
- :
- Re: ** Device Uptime **
** Device Uptime **
Solved- Subscribe to RSS Feed
- Mark Topic as New
- Mark Topic as Read
- Float this Topic for Current User
- Bookmark
- Subscribe
- Mute
- Printer Friendly Page
- Mark as New
- Bookmark
- Subscribe
- Mute
- Subscribe to RSS Feed
- Permalink
- Report Inappropriate Content
** Device Uptime **
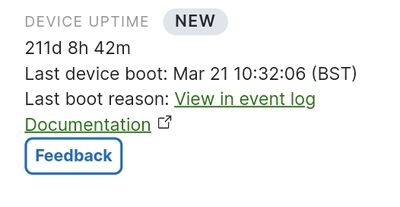
Has appeared on the switch page at the bottom of the left hand side!!!! 🙂
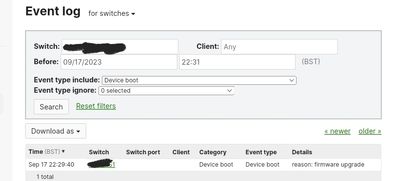
and the event log lists it (shown below for a different switch):
🥳🎉
Solved! Go to solution.
- Mark as New
- Bookmark
- Subscribe
- Mute
- Subscribe to RSS Feed
- Permalink
- Report Inappropriate Content
It's being rolled out in stages https://documentation.meraki.com/General_Administration/Monitoring_and_Reporting/Device_Uptime
- Mark as New
- Bookmark
- Subscribe
- Mute
- Subscribe to RSS Feed
- Permalink
- Report Inappropriate Content
Come on then….who’s got the longest uptime?
https://www.linkedin.com/in/darrenoconnor/
I'm not an employee of Cisco/Meraki. My posts are based on Meraki best practice and what has worked for me in the field.
- Mark as New
- Bookmark
- Subscribe
- Mute
- Subscribe to RSS Feed
- Permalink
- Report Inappropriate Content
What model and firmware ?
- Mark as New
- Bookmark
- Subscribe
- Mute
- Subscribe to RSS Feed
- Permalink
- Report Inappropriate Content
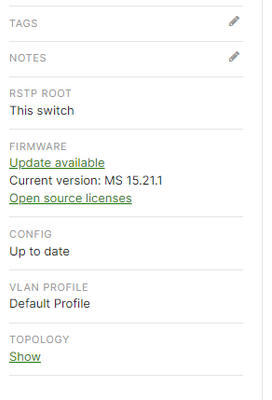
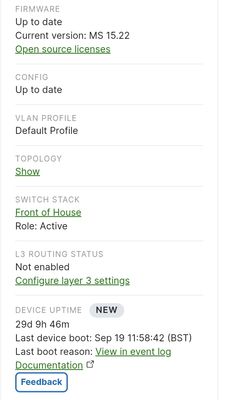
First is MS355-48X on 15.21 and second is MS210-48LP on 15.22
- Mark as New
- Bookmark
- Subscribe
- Mute
- Subscribe to RSS Feed
- Permalink
- Report Inappropriate Content
I don't see that on my networks. Where is it ?
- Mark as New
- Bookmark
- Subscribe
- Mute
- Subscribe to RSS Feed
- Permalink
- Report Inappropriate Content
Finally 😃
Please, if this post was useful, leave your kudos and mark it as solved.
- Mark as New
- Bookmark
- Subscribe
- Mute
- Subscribe to RSS Feed
- Permalink
- Report Inappropriate Content
I don't see anything. 😞
- Mark as New
- Bookmark
- Subscribe
- Mute
- Subscribe to RSS Feed
- Permalink
- Report Inappropriate Content
Not showing for me either 😔
- Mark as New
- Bookmark
- Subscribe
- Mute
- Subscribe to RSS Feed
- Permalink
- Report Inappropriate Content
On shards 184 and 199 for me, here:
- Mark as New
- Bookmark
- Subscribe
- Mute
- Subscribe to RSS Feed
- Permalink
- Report Inappropriate Content
It also shows which switch is managing the stack! The other switch shows member instead of active.
- Mark as New
- Bookmark
- Subscribe
- Mute
- Subscribe to RSS Feed
- Permalink
- Report Inappropriate Content
this one is old 😄
- Mark as New
- Bookmark
- Subscribe
- Mute
- Subscribe to RSS Feed
- Permalink
- Report Inappropriate Content
Nothing on n564 , n216 , n378 .
You must be special !
- Mark as New
- Bookmark
- Subscribe
- Mute
- Subscribe to RSS Feed
- Permalink
- Report Inappropriate Content
We also don't have it showing up. Is this a dashboard item, or does the switch have to be on a certain firmware possibly?
Thanks!
-Scott
- Mark as New
- Bookmark
- Subscribe
- Mute
- Subscribe to RSS Feed
- Permalink
- Report Inappropriate Content
Or is it an error ... and it is going to disappear in 24 hours
- Mark as New
- Bookmark
- Subscribe
- Mute
- Subscribe to RSS Feed
- Permalink
- Report Inappropriate Content
It's being rolled out in stages https://documentation.meraki.com/General_Administration/Monitoring_and_Reporting/Device_Uptime
- Mark as New
- Bookmark
- Subscribe
- Mute
- Subscribe to RSS Feed
- Permalink
- Report Inappropriate Content
I still don't have it. Any idea how long the roll out period is?
- Mark as New
- Bookmark
- Subscribe
- Mute
- Subscribe to RSS Feed
- Permalink
- Report Inappropriate Content
@CDTC what firmware and switch models do you have?
- Mark as New
- Bookmark
- Subscribe
- Mute
- Subscribe to RSS Feed
- Permalink
- Report Inappropriate Content
HAHAHa. Since my post yesterday, it now shows on my Dashboard.
i have a mix of MS120/210/130 and a few others. all running 15.22 or 16.7
Just waiting for all my other devices now MX64/67/105 MR36/46
- Mark as New
- Bookmark
- Subscribe
- Mute
- Subscribe to RSS Feed
- Permalink
- Report Inappropriate Content
The Gnomes saw to it 😉
- Mark as New
- Bookmark
- Subscribe
- Mute
- Subscribe to RSS Feed
- Permalink
- Report Inappropriate Content
Haha lucky!
I'm still waiting... 😔
- Mark as New
- Bookmark
- Subscribe
- Mute
- Subscribe to RSS Feed
- Permalink
- Report Inappropriate Content
MX and MR will come later...hopefully.


