We're migrating to the Cisco Community on March 29. The Meraki Community will enter read-only mode starting on March 26.
Learn more- Technical Forums
- :
- Security & SD-WAN
- :
- Uplink Traffic
Uplink Traffic
- Subscribe to RSS Feed
- Mark Topic as New
- Mark Topic as Read
- Float this Topic for Current User
- Bookmark
- Subscribe
- Mute
- Printer Friendly Page
- Mark as New
- Bookmark
- Subscribe
- Mute
- Subscribe to RSS Feed
- Permalink
- Report Inappropriate Content
Uplink Traffic
I am trying to determine if we need to increase our bandwidth, so I have been monitoring our network usage and uplink traffic. I just want to be sure I know what I am really looking at and am interpreting the information correctly. We are getting ready to start doing a lot of video conferencing and adding another 300 devices to our network and I want to be sure I make the right decision about increasing our bandwidth and if I go by our uplink traffic we are actually going over our allotted bandwidth on a regular basis, but the network usage does not reflect that. Any insight would be appreciated.
- Mark as New
- Bookmark
- Subscribe
- Mute
- Subscribe to RSS Feed
- Permalink
- Report Inappropriate Content
What speed is your circuit, what model MX do you have and how many users are there behind the MX.
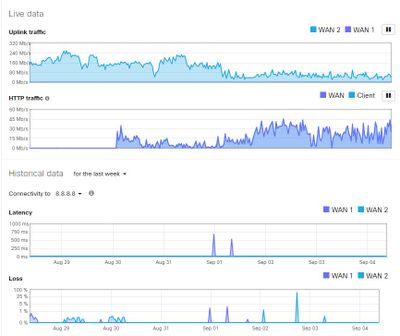
Does the uplink graph show big increases in latency or loss intermittently (or even permanently I guess)? These are a strong indicator your circuit is over subscribed and not coping.
It is also possible you may not have an MX that is powerful or big enough.
- Mark as New
- Bookmark
- Subscribe
- Mute
- Subscribe to RSS Feed
- Permalink
- Report Inappropriate Content
We have an MX 400. We are a 3 section K-8 school with three grade levels on a 1:1, carts of chromebooks and iPads for the younger grades and the middle school has started video conferencing with students that are learning online. We have 675 students, 50 teachers, 5 administrators and we are also a church with about 25 staff members. We have a 200 meg fiber connection. I have some zip files with screen shots of the Live data that I could send you if that helps. I didn't always get the Latency and Loss, but I got a few of them in there. I'm wondering what all the uplink traffic includes as the HTTP traffic doesn't usually doesn't match up to the uplink traffic.
- Mark as New
- Bookmark
- Subscribe
- Mute
- Subscribe to RSS Feed
- Permalink
- Report Inappropriate Content
@dnitzel you can post images inline here. When you say uplink traffic does not match your network usage, what exactly are you comparing?
- Mark as New
- Bookmark
- Subscribe
- Mute
- Subscribe to RSS Feed
- Permalink
- Report Inappropriate Content
Hi, I'm not seeing a place to upload files. What I'm really looking for is what data is included in each graph how to interpret each of the following graphs:
Client Usage
Network Usage
Uplink Traffic
What I am trying to do at the moment is determine if I need to increase our bandwidth since we are doing more video conferencing with students and we are getting ready to add another 225 devices to our network.
- Mark as New
- Bookmark
- Subscribe
- Mute
- Subscribe to RSS Feed
- Permalink
- Report Inappropriate Content
@dnitzel you don't upload files, you simply paste images in-line, as for the graphs:
Client usage has quite short sample times:
For the network usage the sample times are longer so the graph is smoother with fewer data points, in the network used above there is only one MX device in single arm concentrator mode so the graphs match up quite well:
Uplink traffic is near realtime short term traffic, much more granular and therefore shows higher peaks and lower troughs, it is purely the WAN connection(s), showing either Total (upload and download) and download for a single connection or total only for each port in a dual WAN setup:
Uplink is the most accurate but note to get upload you must subtract download from total.
- Mark as New
- Bookmark
- Subscribe
- Mute
- Subscribe to RSS Feed
- Permalink
- Report Inappropriate Content
Thanks for the info. Here are some of the graphs I've screen shot from today...
So for the graph below, if the time is relatively concurrent, why am I seeing such high uplink traffic with very little HTTP traffic? Also, we only have a 200 meg fiber internet line, how is it that I can be using more bandwidth than what we are alloted? Also, WAN 2 is our fail over and we are not using it, but I find it interesting that I occasionally see latency and loss on that connection.
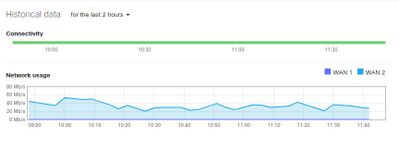
Here is our Network Usage for today so far...
I'm not seeing anywhere near the traffic that I see on the Uplink graph. Does it just average the usage over a certain period of time, potentially lowering the overall usage? It seem like a pretty drastic difference.
Here is the Client usage graph for the week...
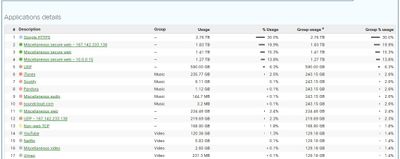
The reason I chose the week view is because it shows peaks of over 600mb/s and with a 200 meg line how am I getting 600 mb/s? I have included a screen shot of the highest usage on the Application Details as well.
So to determine if I need to increase my bandwidth and by how much, do I want to mainly look at my Uplink and HTTP graphs, or do I need to take all three into consideration. If the later is the case, how much emphasis do I put on each one, is there some sort of formula or process I should use? As you can tell, I'm not well versed in this stuff and am learning as I go, so any info you can give me would be helpful. Thanks
- Mark as New
- Bookmark
- Subscribe
- Mute
- Subscribe to RSS Feed
- Permalink
- Report Inappropriate Content
@dnitzel as you have 2 WANs the graph only shows total traffic, so your peak of 250Mbps could be 125Mb upload and 125Mb download at the same time. It is likely to be less evenly split but unfortunately you cannot tell when you have 2 WAN links. The WAN1 link seems to be doing very little, is it in use?
What firmware/license are you on, I am running 15.32 on the unit I showed and the Enterprise license, sorry I don't see that graph and don't know what it is supposed to show, if you hover over the (i) does it include https, QUIC etc.? I'd guess it is fairly useless for overall traffic metrics.
For the clients if you have more than an MX, select only security appliance clients and you should see a better representation of the WAN load, though again it is total traffic, i.e. upload and download. Unless you have a lot of backups from local sources to cloud or streaming to cloud, then I would assume that if you take either the uplink total or the security appliance client total, this should show roughly what line speed you are using now, I'd take 3/5 of that as a best guess for download going by the client total vs upload vs download, though I think 4/5 is more usual looking at other sites of ours. Therefore in your case I'd say you have 200Mb peaks which actually matches your line speed.
- Mark as New
- Bookmark
- Subscribe
- Mute
- Subscribe to RSS Feed
- Permalink
- Report Inappropriate Content
So if I have 200 meg up and down, in light of the uplink graph, do I actually have 400 meg to work with? My WAN 1 is our failover that isn't used unless WAN 2 fails, although WAN 1 is currently in a Failed state and I'm not sure why that is, but I do see it reflected on the latency and occasionally on the loss graphs.
I'm using the old dashboard as I like the graphs on it better. The Network Usage graph is on the Summary tab in the old dashboard. It doesn't give me any more information than what you see.
The MX is the only security appliance that we have. I did switch over to Only Security Appliance Clients and that did drop the usage down quite a bit, so where are the other clients coming from? Would that be internal traffic?
- Mark as New
- Bookmark
- Subscribe
- Mute
- Subscribe to RSS Feed
- Permalink
- Report Inappropriate Content
In terms of total traffic either on network usage, clients or uplink you have 400Mbps, however you need to get an idea of what proportion of your traffic is down and what is up as you only have 200Mbps of either.
The other traffic is either internal WiFi traffic if you have MRs or internal wired traffic if you have MSs, you can change to see each separately. For WAN link calculations ignore non appliance traffic. At that view what is the up and down showing proportionally?
- Mark as New
- Bookmark
- Subscribe
- Mute
- Subscribe to RSS Feed
- Permalink
- Report Inappropriate Content
If I unplug WAN 1, will that allow me to see upload and download traffic separately, or is there a better way to separate my upload and download traffic?
Here is the Client graph after I set it to only security appliance clients...
- Mark as New
- Bookmark
- Subscribe
- Mute
- Subscribe to RSS Feed
- Permalink
- Report Inappropriate Content
I see on your uplink graph you sent earlier that it shows total and download. Mine shows Wan 1 & 2. is there something I need to do to get the total and download for the Uplink graph?
- Mark as New
- Bookmark
- Subscribe
- Mute
- Subscribe to RSS Feed
- Permalink
- Report Inappropriate Content
@dnitzel you'd need to unconfigure one of the WAN links, as one of yours is backup I'd unconfogure it for a few hours when you have someone at the site and you will see total and download.
- Mark as New
- Bookmark
- Subscribe
- Mute
- Subscribe to RSS Feed
- Permalink
- Report Inappropriate Content
How do I unconfigure it?
- Mark as New
- Bookmark
- Subscribe
- Mute
- Subscribe to RSS Feed
- Permalink
- Report Inappropriate Content
Go to the uplink tab and click on the pencil next to WAN1 and change it from static or dhcp to disabled.
Make sure you set the primary WAN to WAN 2 first to minimise disruption, found under SD-WAN & traffic shaping.
- Mark as New
- Bookmark
- Subscribe
- Mute
- Subscribe to RSS Feed
- Permalink
- Report Inappropriate Content
After I disabled WAN 1 the key still shows WAN 1 & 2 and not Total and Download.
- Mark as New
- Bookmark
- Subscribe
- Mute
- Subscribe to RSS Feed
- Permalink
- Report Inappropriate Content
Do I need to get out of the Dashboard and back in for the change to take effect?
-
3rd Party VPN
174 -
ACLs
91 -
Auto VPN
305 -
AWS
36 -
Azure
70 -
Client VPN
382 -
Firewall
866 -
iOS
1 -
Other
557 -
Wireless LAN MR
1


