Get answers from our community of experts in record time.
Join now- Technical Forums
- :
- Security & SD-WAN
- :
- Re: Organizational Summary: Uplinks Loss/Availability data for >5 minutes s...
Organizational Summary: Uplinks Loss/Availability data for >5 minutes span?
Solved- Subscribe to RSS Feed
- Mark Topic as New
- Mark Topic as Read
- Float this Topic for Current User
- Bookmark
- Subscribe
- Mute
- Printer Friendly Page
- Mark as New
- Bookmark
- Subscribe
- Mute
- Subscribe to RSS Feed
- Permalink
- Report Inappropriate Content
Organizational Summary: Uplinks Loss/Availability data for >5 minutes span?
Hello, we had some packet loss earlier on a couple WAN2 links. I was fortunate enough to look at the Organizational Summary within 5 minutes to be able to see this reflected (in screenshot above).
Is this Uplink loss/availability data available anywhere else in the dashboard for a more historic span than 5 minutes?
Thanks.
Solved! Go to solution.
- Labels:
-
Other
- Mark as New
- Bookmark
- Subscribe
- Mute
- Subscribe to RSS Feed
- Permalink
- Report Inappropriate Content
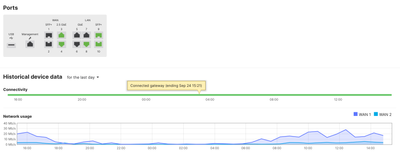
Security & SD-Wan > Appliance Status > Summary shows green/red indicator for connectivity or outage.
Or Security & SD-Wan > Appliance Status > Uplink will show missing areas if WAN1 or WAN2 are down.
In the example above the cellular uplink was repositioned twice and you can see WAN2 outage for brief periods (latency).
-
3rd Party VPN
164 -
ACLs
88 -
Auto VPN
287 -
AWS
36 -
Azure
66 -
Client VPN
368 -
Firewall
833 -
iOS
1 -
Other
540 -
Wireless LAN MR
1


