We're migrating to the Cisco Community on March 29. The Meraki Community will enter read-only mode starting on March 26.
Learn more- Technical Forums
- :
- Security & SD-WAN
- :
- Re: Is anyone pulling Firewall hits from the MX syslog output
Is anyone pulling Firewall hits from the MX syslog output
Solved- Subscribe to RSS Feed
- Mark Topic as New
- Mark Topic as Read
- Float this Topic for Current User
- Bookmark
- Subscribe
- Mute
- Printer Friendly Page
- Mark as New
- Bookmark
- Subscribe
- Mute
- Subscribe to RSS Feed
- Permalink
- Report Inappropriate Content
Is anyone pulling Firewall hits from the MX syslog output
I am pulling firewall hits out of of the syslog output and then loading to Excel for analysis.
The MX logs go to a Linux syslog server and then I use awk to process and format the hits on the rules.
I plan to summarize the results and send it out via email to our security team.
This is really helpful when we get a call asking if the firewall is blocking traffic. I can quickly tell whether they are hitting a rule, and which rule they are hitting.
Is anyone doing anything like this?
Solved! Go to solution.
- Mark as New
- Bookmark
- Subscribe
- Mute
- Subscribe to RSS Feed
- Permalink
- Report Inappropriate Content
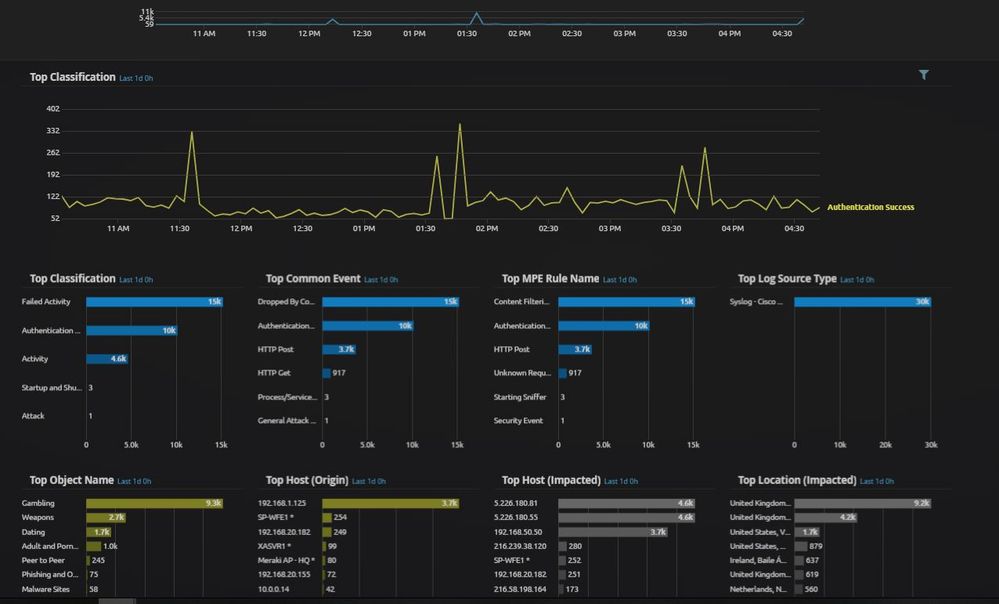
This pic doesn't have have the firewall hits but you get the jist (has other MX logs)...
You can change the charts to other chart types if that takes your fancy and you can put any data into the charts that the log contains. LogRhythm has built in parsing for the Meraki Syslog so that's convenient!
You can also generate reports as you'd expect which would look like @PaulHenry's or add the charts to it.
- Mark as New
- Bookmark
- Subscribe
- Mute
- Subscribe to RSS Feed
- Permalink
- Report Inappropriate Content
We just output ours to our SIEM solution (LogRhythm) which then displays the data nicely
- Mark as New
- Bookmark
- Subscribe
- Mute
- Subscribe to RSS Feed
- Permalink
- Report Inappropriate Content
Haydn, Thanks for the quick reply.
This a sample of the output that I get from my scripts. Can you get something similar from LogRhythm? It took me some time to figure out how to cut the correct columns from the syslog output.
| count | protocol | Source IP | Dest IP | Dest Port | allow/deny | Rule |
| 69 | protocol=tcp | src=10.1.100.134 | dst=10.1.201.101 | dport=8443 | allow | tcp&&(dst10.1.201.0/24)&&(dstport8080||dstport8443)&&(src10.1.100.0/24) |
| 13811 | protocol=tcp | src=10.1.200.10 | dst=10.1.201.100 | dport=8080 | allow | tcp&&(dst10.1.201.0/24)&&(dstport8080||dstport8443)&&(src10.1.200.0/24) |
| 5315 | protocol=tcp | src=10.1.200.10 | dst=10.1.201.101 | dport=8443 | allow | tcp&&(dst10.1.201.0/24)&&(dstport8080||dstport8443)&&(src10.1.200.0/24) |
- Mark as New
- Bookmark
- Subscribe
- Mute
- Subscribe to RSS Feed
- Permalink
- Report Inappropriate Content
Which syslog output is it for seeing that? Security Events?
Also, could you provide a picture of what that looks like? Curious 😃
Thanks !
- Mark as New
- Bookmark
- Subscribe
- Mute
- Subscribe to RSS Feed
- Permalink
- Report Inappropriate Content
This is a line of output from the MX250 log:
2019-04-29T10:13:45.512222-04:00 alb-mx250 1556547225.512287760 MENANDS_MX1 flows src=10.2.100.24 dst=10.1.100.144 mac=A0:3D:6F:C7:
70:11 protocol=tcp sport=60935 dport=80 pattern: allow (dst 10.1.3.0/24 || dst 10.1.5.0/24 || dst 10.1.10.0/24 || dst 10.1.100.0/24
|| dst 10.1.250.0/24 || dst 10.2.100.0/24 || dst 10.3.100.0/24) && (src 10.1.3.0/24 || src 10.1.5.0/24 || src 10.1.10.0/24 || src 10
.1.100.0/24 || src 10.1.250.0/24 || src 10.2.100.0/24 || src 10.3.100.0/24)
I parse, chop and summarize this into a report.
- Mark as New
- Bookmark
- Subscribe
- Mute
- Subscribe to RSS Feed
- Permalink
- Report Inappropriate Content
This pic doesn't have have the firewall hits but you get the jist (has other MX logs)...
You can change the charts to other chart types if that takes your fancy and you can put any data into the charts that the log contains. LogRhythm has built in parsing for the Meraki Syslog so that's convenient!
You can also generate reports as you'd expect which would look like @PaulHenry's or add the charts to it.
- Mark as New
- Bookmark
- Subscribe
- Mute
- Subscribe to RSS Feed
- Permalink
- Report Inappropriate Content
Wow! That looks great. I enjoy using my 30-year-old awk, grep and regex skills, but I want to put something more robust in place. I will look at LogRhythm.
One last question: Where do you store your logs?
Thanks,
- Mark as New
- Bookmark
- Subscribe
- Mute
- Subscribe to RSS Feed
- Permalink
- Report Inappropriate Content
Our LogRhythm appliance is physical so all logs get sent to that 🙂
- Mark as New
- Bookmark
- Subscribe
- Mute
- Subscribe to RSS Feed
- Permalink
- Report Inappropriate Content
splunk
-
3rd Party VPN
174 -
ACLs
91 -
Auto VPN
305 -
AWS
36 -
Azure
70 -
Client VPN
382 -
Firewall
866 -
iOS
1 -
Other
557 -
Wireless LAN MR
1

