We're migrating to the Cisco Community on March 29. The Meraki Community will enter read-only mode starting on March 26.
Learn more- Technical Forums
- :
- Mobile Device Management
- :
- Re: Internal data traffic Vs External Internet Data traffic
Internal data traffic Vs External Internet Data traffic
- Subscribe to RSS Feed
- Mark Topic as New
- Mark Topic as Read
- Float this Topic for Current User
- Bookmark
- Subscribe
- Mute
- Printer Friendly Page
- Mark as New
- Bookmark
- Subscribe
- Mute
- Subscribe to RSS Feed
- Permalink
- Report Inappropriate Content
Internal data traffic Vs External Internet Data traffic
I am viewing the page Network-wide >> Clients and I need help.
When I view the full picture graphic of the download and upload I am seeing all traffic in the network.
This includes:
1. Traffic between internal devices and external sources (i.e. websites, external and cloud storage, streaming content and more.)
2. Traffic between internal devices and internal sources i.e. laptop or PC to Share Drive, NAS, Video and Audio on demand systems and more.
The problem is that I need to remove all connection's classified as No.2. to get a better picture of the Internet usage across the entire system. We have limited internet due to our location and restricting and shaping the internet traffic is critical to our operation. Currently as soon as a client device uploads photographs or large files to the server the interpretation of the data in the network goes out the window. So is it possible to use a filter in the client table to achieve this? Will the forget button perform this task? What is the best way to do this?
Much appreciated any support.
- Labels:
-
Monitoring
- Mark as New
- Bookmark
- Subscribe
- Mute
- Subscribe to RSS Feed
- Permalink
- Report Inappropriate Content
Greetings,
There are two ways to approach this issue.
1. You can configure a slice with an IP Range skipping the RFC1918 addresses
https://documentation.meraki.com/MR/Monitoring_and_Reporting/Hostname_Visibility
2. You can use a Netflow collector and then in your preferred collector, filter traffic as you wish
https://documentation.meraki.com/MX/Monitoring_and_Reporting/NetFlow_Overview
Keep in mind that both solutions will start collecting data after being configured, and you should not expect to see historical traffic.
- Mark as New
- Bookmark
- Subscribe
- Mute
- Subscribe to RSS Feed
- Permalink
- Report Inappropriate Content
Hi Bettencourt
Thank you for all your responses. May I ask if I create a slice, where will or should I be able to see this traffic pie chart? Traffic Analysis isn't showing a separate graph. I will now look into the Netflow collector.
- Mark as New
- Bookmark
- Subscribe
- Mute
- Subscribe to RSS Feed
- Permalink
- Report Inappropriate Content
You would see a pie under Network-wide > Clients then at the top where it says Applications click the arrow to the right or left to change the pie type.
- Mark as New
- Bookmark
- Subscribe
- Mute
- Subscribe to RSS Feed
- Permalink
- Report Inappropriate Content
This answer depends on your network.
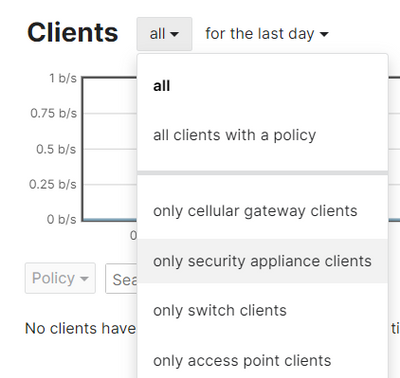
If you have an MX, and it doesn't perform internal routing, then you filter the Network-Wide/Clients view to only see the MX clients, which will only be traffic going to the Internet.
- Mark as New
- Bookmark
- Subscribe
- Mute
- Subscribe to RSS Feed
- Permalink
- Report Inappropriate Content
What could the reason be for not seeing the options under "all"? I can only see the "clients with a policy"

