- Technical Forums
- :
- Developers & APIs
- :
- Re: Timespan portion of Network client APIs seems to be off
Timespan portion of Network client APIs seems to be off
- Subscribe to RSS Feed
- Mark Topic as New
- Mark Topic as Read
- Float this Topic for Current User
- Bookmark
- Subscribe
- Mute
- Printer Friendly Page
- Mark as New
- Bookmark
- Subscribe
- Mute
- Subscribe to RSS Feed
- Permalink
- Report Inappropriate Content
Timespan portion of Network client APIs seems to be off
I am trying to get a days worth of network history for each client. The Meraki API v1 documentation says that the timespan should be in seconds. However, if I set the timespan for 86400 seconds, I only get 8 hours worth of usage history. I tried tripling that number, but that gave me way more than a day's worth of history.
Am I using the timespan portion of this function correctly? What number should I be using to get a day's worth of content? The code I used to get the usage history is below.
client_usage[client_id] = dashboard.networks.getNetworkClientsUsageHistories(nwID, client_id, timespan='86400')
Using:
Mac OS 11.2.2
VS Code
Python 3.8.2
Meraki SDK 1.7.1
- Labels:
-
Dashboard API
- Mark as New
- Bookmark
- Subscribe
- Mute
- Subscribe to RSS Feed
- Permalink
- Report Inappropriate Content
by default you are only getting one page as the result set.
You can try to download all pages in the timespan
client_usage[client_id] = dashboard.networks.getNetworkClientsUsageHistories(nwID, client_id, timespan='86400', total_pages='all')
- Mark as New
- Bookmark
- Subscribe
- Mute
- Subscribe to RSS Feed
- Permalink
- Report Inappropriate Content
Thanks for the reply. Given the output I got when I tried different timespans, I had a feeling this was not the case.
After trying your suggestion, I can tell you that the results are either,
1. The same (when I tried ts='86400')
OR
2. Only slightly different (a difference of one 20 minute time interval when I tried a different ts)
I'm not sure what has changed, but when I previously ran the function at ts='86400' I received 8 hours of data, but when I tried this time I only received 2 hours and 20 minutes of non-continuous data over a period of a day. This is unrelated from your suggestion as I get the same data with or without total_pages.
Does anyone also know why I would suddenly get less and non-continuous data for the same client ID and same ts?
- Mark as New
- Bookmark
- Subscribe
- Mute
- Subscribe to RSS Feed
- Permalink
- Report Inappropriate Content
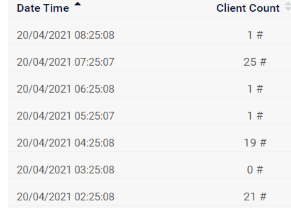
Hello CPEERS
I have the same doubt you described in your post.
I am struggling to understand how to combine the "timespan" parameter with a "polling frequency".
I am collecting the number of clients associated per Meraki Access Point or Network using the following URL:
In order to avoid the API Rate Limit I am collecting the result every hour using PRTG.
The timespan used inside the URL is also 3600 seconds (1 hour).
The problem is that the data is coming in a very inconsistent way.
Please, could you help me to understand how can I use the Meraki API timespan correctly ?
What is the recommended time interval to collect the connected clients ?
When I am using MERAKI APIs that do not have the "timespan" feature I can collect reliable data.
If I have to use the timespan in other APIs the data never comes like it is in reality.
Regards,
- Mark as New
- Bookmark
- Subscribe
- Mute
- Subscribe to RSS Feed
- Permalink
- Report Inappropriate Content
Did you ever find an answer to this question? I'm looking to pull signal quality and channel utilization data and running into the same question, how do I use timespan correctly?
- Mark as New
- Bookmark
- Subscribe
- Mute
- Subscribe to RSS Feed
- Permalink
- Report Inappropriate Content
... and I just figured out my issue. I wasn't specifying the resolution to give me the granularity I wanted. The default resolution is 86400 seconds. I needed to reduce it to 300.
-
Bluetooth
13 -
Captive Portal API
33 -
Code Sample
131 -
Dashboard API
711 -
Getting Started
11 -
MQTT
2 -
MV Sense
9 -
Other
8 -
Python
16 -
Scanning API
78 -
Updates from Meraki
81 -
Webhooks
40 -
Webinars
11

