- Technical Forums
- :
- Developers & APIs
- :
- Re: Python getNetworkApplianceUplinksUsageHistory
Python getNetworkApplianceUplinksUsageHistory
- Subscribe to RSS Feed
- Mark Topic as New
- Mark Topic as Read
- Float this Topic for Current User
- Bookmark
- Subscribe
- Mute
- Printer Friendly Page
- Mark as New
- Bookmark
- Subscribe
- Mute
- Subscribe to RSS Feed
- Permalink
- Report Inappropriate Content
Python getNetworkApplianceUplinksUsageHistory
Hi guys,
I`m developing a simple PowerBI to show the traffic history, but i`m facing a divergency between the Meraki sumary report data and the data that comes through python library
The python library is always showing more traffic than the dashboard
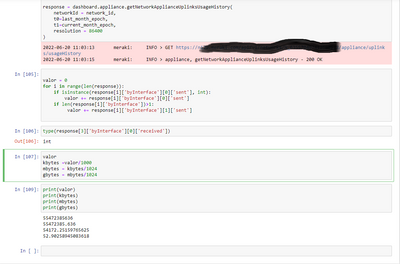
this is my simple method to return the bytes and convert to GB
It`s display a 52GB of usage.
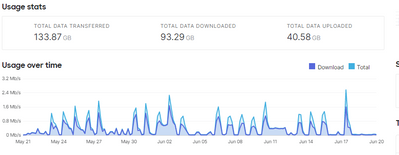
And this is the same in the dashboard, which display a 40GB
I trying to figure it out but no success so far.
I'm using a 30 days timespan
Thanks
- Mark as New
- Bookmark
- Subscribe
- Mute
- Subscribe to RSS Feed
- Permalink
- Report Inappropriate Content
I'm also seeing a massive discrepancy between the data from this API call and what Dashboard shows.
For a network that contains only an MX84 HA pair, with dual WAN links:
For 20th June (from 000000 to 23599 UTC), with 600 second sample period, API data says...
Total Tx bytes 1,484,364,604
Tota Rx bytes 982,713,386
Changing to a 3600 seconds sample period gives only slightly different values 1,453,143,728 and 953,523,815 so it isn't especially sensitive to sample period.
Also, looking at the numbers returned, the reported bytes transferred (both tx and rx) in the 600 seconds often far exceeds the capacity of the WAN link.
Dashboard summary report for that network on the same day...
Total data uploaded 490.7 MB
Total data downloaded 404.3 MB
I also checked on an MX65W, the API reports c. 150MB for both send and received, the Dashboard summary reports 0 kilobytes for both, again a big discrepancy.
The API call is reporting more than twice the Dashboard figure, and also impossibly high transfer rates for the sample time period.
Seems clear the API call is returning bad data.
- Mark as New
- Bookmark
- Subscribe
- Mute
- Subscribe to RSS Feed
- Permalink
- Report Inappropriate Content
Hello, Sungod
I was about to contact the Cisco support and they show me a different documentation
it's V0 docs, but the Python methods still work
I tried in a few networks and the diff between data is really low.
I hope it helps
- Mark as New
- Bookmark
- Subscribe
- Mute
- Subscribe to RSS Feed
- Permalink
- Report Inappropriate Content
That looks like it'd be ok for aggregate, but I'm really after the physical link details as a time series.
I'll open a support case when I get some time.
- Mark as New
- Bookmark
- Subscribe
- Mute
- Subscribe to RSS Feed
- Permalink
- Report Inappropriate Content
Right.
If you get someexplanation, please reply here.
Have a nice week
- Mark as New
- Bookmark
- Subscribe
- Mute
- Subscribe to RSS Feed
- Permalink
- Report Inappropriate Content
Fyi I opened a case on this and they confirmed it's an issue being worked on.
- Mark as New
- Bookmark
- Subscribe
- Mute
- Subscribe to RSS Feed
- Permalink
- Report Inappropriate Content
Did you get an idea from them when it might be fixed?
- Mark as New
- Bookmark
- Subscribe
- Mute
- Subscribe to RSS Feed
- Permalink
- Report Inappropriate Content
No, I'm assuming it's going to be weeks/months, but that's just my guess.
Fwiw a non-Cisco SDWAN vendor had a similar issue with their API, took over a year and several attempts for them to fix it.
I've learned patience 😃
- Mark as New
- Bookmark
- Subscribe
- Mute
- Subscribe to RSS Feed
- Permalink
- Report Inappropriate Content
Did you manage to get a response from them as to when you think this issue will be resolved ?
Thanks
- Mark as New
- Bookmark
- Subscribe
- Mute
- Subscribe to RSS Feed
- Permalink
- Report Inappropriate Content
The last test I ran still showed a few crazy readings on the 6th, ok since then.
I'd guess they are near resolution, but still need to wait for formal confirmation.
-
Bluetooth
13 -
Captive Portal API
33 -
Code Sample
131 -
Dashboard API
709 -
Getting Started
11 -
MQTT
2 -
MV Sense
9 -
Other
7 -
Python
16 -
Scanning API
78 -
Updates from Meraki
80 -
Webhooks
40 -
Webinars
11


