We're migrating to the Cisco Community on March 29. The Meraki Community will enter read-only mode starting on March 26.
Learn more- Technical Forums
- :
- Developers & APIs
- :
- Re: Any APIs to make a graph about traffic-flow by time?
Any APIs to make a graph about traffic-flow by time?
Solved- Subscribe to RSS Feed
- Mark Topic as New
- Mark Topic as Read
- Float this Topic for Current User
- Bookmark
- Subscribe
- Mute
- Printer Friendly Page
- Mark as New
- Bookmark
- Subscribe
- Mute
- Subscribe to RSS Feed
- Permalink
- Report Inappropriate Content
Any APIs to make a graph about traffic-flow by time?
Hi there,
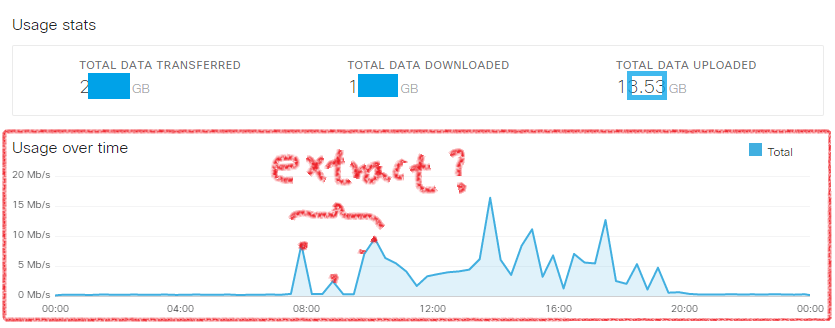
We all see the graph of traffic by time to time within a day,
and I want to extract the usage amount in total network and make a new graph using Meraki dashboard APIs by python.
(ex - a bar graph moving to the left by 30 minutes interval automatically)
I found some APIs about traffic like
'Get Network Traffic - https://developer.cisco.com/meraki/api/#/rest/api-endpoints/networks/get-network-traffic' and 'Get Network Client Usage History - https://developer.cisco.com/meraki/api/#/rest/api-endpoints/clients/get-network-client-usage-history'
But in 'Get Network Client Usage History', I can find only 1-day data not specific time interval(ex - 15 mins),
and in 'Get Network Traffic', I cannot see the total flow of usage data.
Do you know any proper APIs to make a graph like the image above?
Best Regards,
Solved! Go to solution.
- Labels:
-
Dashboard API
- Mark as New
- Bookmark
- Subscribe
- Mute
- Subscribe to RSS Feed
- Permalink
- Report Inappropriate Content
I don't see any API's that are perfectly suited for this task. I would probably use this API:
https://api.meraki.com/api_docs#list-the-clients-that-have-used-this-network-in-the-timespan
To grab every client in a network for each time period, and then do some math inside my script to add up the total bytes sent and received from each client to get the totals needed to display a graph.
- Mark as New
- Bookmark
- Subscribe
- Mute
- Subscribe to RSS Feed
- Permalink
- Report Inappropriate Content
- Mark as New
- Bookmark
- Subscribe
- Mute
- Subscribe to RSS Feed
- Permalink
- Report Inappropriate Content
When I tried making codes with API you recommended, I could get the result of real-time usage!
I am going to study more and make an output I wanted.
Thank you again!
- Mark as New
- Bookmark
- Subscribe
- Mute
- Subscribe to RSS Feed
- Permalink
- Report Inappropriate Content
Oh cool. Good to know you can get that info from that API. Thanks for reporting back!
- Mark as New
- Bookmark
- Subscribe
- Mute
- Subscribe to RSS Feed
- Permalink
- Report Inappropriate Content
I am trying to use
Return is like following:
the timestamps we are getting are in date value, not getting any date and time values. Can someone tell me the reason?
- Mark as New
- Bookmark
- Subscribe
- Mute
- Subscribe to RSS Feed
- Permalink
- Report Inappropriate Content
For instance, timestamp 1557964800.0 can be converted to 2019-May-16 Thursday AM 12:00:00 (GMT).
It includes time values.
But why do you think you only can get date values?
- Mark as New
- Bookmark
- Subscribe
- Mute
- Subscribe to RSS Feed
- Permalink
- Report Inappropriate Content
As the time value, after conversion we are always getting 00:00:00, no other real values after conversion.If you check the example I shared, all the ts values ends with "00"
I am not sure if I need to add activeSeconds with the ts value or not
- Mark as New
- Bookmark
- Subscribe
- Mute
- Subscribe to RSS Feed
- Permalink
- Report Inappropriate Content
@Kausik , did you ever solve the issue where trafficHistory is only returning the date? I'm running into the same problem.
-
Bluetooth
3 -
Captive Portal API
11 -
Code Sample
63 -
Dashboard API
376 -
Getting Started
10 -
Other
6 -
Python
13 -
Scanning API
28 -
Updates from Meraki
50 -
Webhooks
19 -
Webinars
6


