Get answers from our community of experts in record time.
Join now- Technical Forums
- :
- Dashboard & Administration
- :
- Issues with rsyslog connected to Microsoft Sentinel (previus: Azure Sentine...
Issues with rsyslog connected to Microsoft Sentinel (previus: Azure Sentinel)
- Subscribe to RSS Feed
- Mark Topic as New
- Mark Topic as Read
- Float this Topic for Current User
- Bookmark
- Subscribe
- Mute
- Printer Friendly Page
- Mark as New
- Bookmark
- Subscribe
- Mute
- Subscribe to RSS Feed
- Permalink
- Report Inappropriate Content
Issues with rsyslog connected to Microsoft Sentinel (previus: Azure Sentinel)
Hey folks,
I don't get the connection between Microsoft Sentinel and my rsyslog to Azure Log Analytics VM.
I mean, the connection seems fine, as I am getting the heartbeat in Sentinel.
This is the tcpdump on my VM:
root@LogAnalytics:~# tcpdump -i ens3 port 514
tcpdump: verbose output suppressed, use -v[v]... for full protocol decode
listening on ens3, link-type EN10MB (Ethernet), snapshot length 262144 bytes
18:27:04.404979 IP my.meraki.net.48496 > LogAnalytics.syslog: SYSLOG local0.info, length: 171
18:27:04.405020 IP my.meraki.net.48496 > LogAnalytics.syslog: SYSLOG local0.info, length: 163
18:27:04.405029 IP my.meraki.net.48496 > LogAnalytics.syslog: SYSLOG local0.info, length: 158
18:27:04.405032 IP my.meraki.net.48496 > LogAnalytics.syslog: SYSLOG local0.info, length: 158
So this seems to work, but in the Microsoft sentinel panel i got nothing but the Heartbeat:
This is my config.
/etc/opt/microsoft/omsagent/<workspace-id>/conf/omsagent.d/meraki.conf
<source>
  type tcp
  format none
  port 22033
  bind 0.0.0.0
  delimiter "\n"
  tag oms.api.meraki
</source>

<match oms.api.meraki>
  type out_oms_api
  log_level info
  num_threads 5
  omsadmin_conf_path /etc/opt/microsoft/omsagent/<workspace-id>/conf/omsadmin.conf
  cert_path /etc/opt/microsoft/omsagent/<workspace-id>/certs/oms.crt
  key_path /etc/opt/microsoft/omsagent/<workspace-id>/certs/oms.key
  buffer_chunk_limit 10m
  buffer_type file
  buffer_path /var/opt/microsoft/omsagent/<workspace-id>/state/out_oms_api_meraki*.buffer
  buffer_queue_limit 10
  buffer_queue_full_action drop_oldest_chunk
  flush_interval 30s
  retry_limit 10
  retry_wait 30s
  max_retry_wait 9m
</match>
/etc/rsyslog.d/10-meraki.conf
if $rawmsg contains "flows" then @@127.0.0.1:22033;meraki& stop
if $rawmsg contains "urls" then @@127.0.0.1:22033;meraki& stop
if $rawmsg contains "ids-alerts" then @@127.0.0.1:22033;meraki& stop
if $rawmsg contains "events" then @@127.0.0.1:22033;meraki& stop
if $rawmsg contains "ip_flow_start" then @@127.0.0.1:22033;meraki& stop
if $rawmsg contains "ip_flow_end" then @@127.0.0.1:22033;meraki& stop
And last but not least the first lines of my /etc/rsyslog.conf
# /etc/rsyslog.conf configuration file for rsyslog
#
# For more information install rsyslog-doc and see
# /usr/share/doc/rsyslog-doc/html/configuration/index.html


#################
#### MODULES ####
#################

module(load="imuxsock") # provides support for local system logging
module(load="imklog")   # provides kernel logging support
#module(load="immark")  # provides --MARK-- message capability

# provides UDP syslog reception
module(load="imudp")
input(type="imudp" port="514")

# provides TCP syslog reception
module(load="imtcp")
input(type="imtcp" port="514")

# Meraki custom stufF
$template meraki,"%timestamp% %hostname% %msg%\n"
What am i missing?
I am not getting any entries in the "meraki_CL" table.
-What kind of logs can I create, that should appear in Sentinel as well?
Thanks 🙂
- Labels:
-
Administrators
-
Other
- Mark as New
- Bookmark
- Subscribe
- Mute
- Subscribe to RSS Feed
- Permalink
- Report Inappropriate Content
I have no idea. But perhaps use tcpdump, and verify that the syslog messages are actually arriving to the box first. This should dump all UDP packets.
tcpdump -n udp
- Mark as New
- Bookmark
- Subscribe
- Mute
- Subscribe to RSS Feed
- Permalink
- Report Inappropriate Content
Hey @PhilipDAth,
Syslog is sent to the device:
tcpdump -n udp
14:37:15.136967 IP 10.0.0.1.45896 > 10.0.0.4.514: SYSLOG local0.info, length: 127
tcpdump -i ens3 port 514
14:37:26.240614 IP my.meraki.net.47981 > LogAnalytics.syslog: SYSLOG local0.info, length: 173
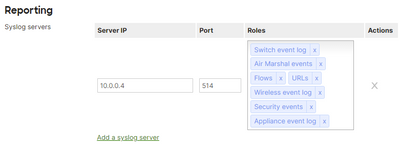
Configured properly in the dashboard:
I only receive the heartbeat messages from the omsagent. 😕
- Mark as New
- Bookmark
- Subscribe
- Mute
- Subscribe to RSS Feed
- Permalink
- Report Inappropriate Content
If you've not yet figured this out, the "& stop" need to be on a separate line. That was a typo in the Sentinel instructions.
- Mark as New
- Bookmark
- Subscribe
- Mute
- Subscribe to RSS Feed
- Permalink
- Report Inappropriate Content
Did you manage to fix it?
- Mark as New
- Bookmark
- Subscribe
- Mute
- Subscribe to RSS Feed
- Permalink
- Report Inappropriate Content
Wondering the same here. My configuration looks pretty much identical, I did modify my 10-meraki.conf to put each &stop on a separate line.
-
Administrators
222 -
Change log
13 -
Firmware upgrades
29 -
Inventory
45 -
Licensing
75 -
Meraki mobile app
12 -
Other
162


