We're migrating to the Cisco Community on March 29. The Meraki Community will enter read-only mode starting on March 26.
Learn more- Technical Forums
- :
- Dashboard & Administration
- :
- Re: Early Access: Client360-Cloud
Early Access: Client360-Cloud
- Subscribe to RSS Feed
- Mark Topic as New
- Mark Topic as Read
- Float this Topic for Current User
- Bookmark
- Subscribe
- Mute
- Printer Friendly Page
- Mark as New
- Bookmark
- Subscribe
- Mute
- Subscribe to RSS Feed
- Permalink
- Report Inappropriate Content
Early Access: Client360-Cloud
- Mark as New
- Bookmark
- Subscribe
- Mute
- Subscribe to RSS Feed
- Permalink
- Report Inappropriate Content
- Mark as New
- Bookmark
- Subscribe
- Mute
- Subscribe to RSS Feed
- Permalink
- Report Inappropriate Content
I opted in. What does it do?
- Mark as New
- Bookmark
- Subscribe
- Mute
- Subscribe to RSS Feed
- Permalink
- Report Inappropriate Content
Provides a comprehensive and detailed view of individual client experiences across wired, wireless, and remote connections. Its main goal is to enhance visibility, simplify troubleshooting, and ensure optimal performance for all users on the network. For me, it's a helpful troubleshooting tool (where in lies the root issue).
- Mark as New
- Bookmark
- Subscribe
- Mute
- Subscribe to RSS Feed
- Permalink
- Report Inappropriate Content
Looks nice but why did they drop the application/traffic overview from the new client view ? Is that still a roadmap thing ?
- Mark as New
- Bookmark
- Subscribe
- Mute
- Subscribe to RSS Feed
- Permalink
- Report Inappropriate Content
Does anyone else NOT have any applications visible in this new view?
There are 3 checkboxes on top right but they are greyed out and one of them is applications.
- Mark as New
- Bookmark
- Subscribe
- Mute
- Subscribe to RSS Feed
- Permalink
- Report Inappropriate Content
Not exactly sure which view or screen you are referring to.
The devices on the new topology view are clickable, and they provide specific information depending on the type of device selected. Please note that the amount of data shown for each device varies as not all their live metrics are stored for historical view.
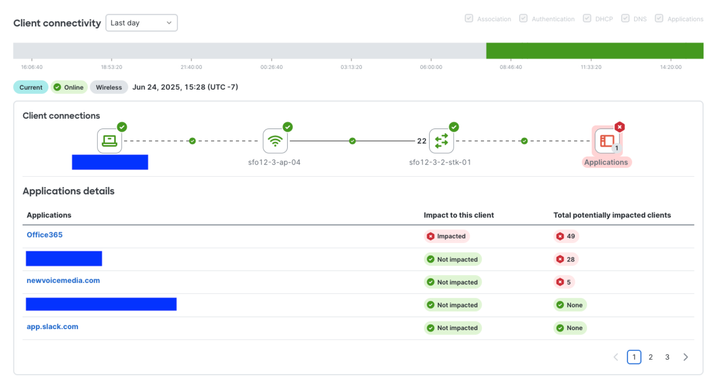
The Application icon is only available if the Meraki + ThousandEyes integration is activated for the client network.
When clicking on the Application icon, we show information about application outages and whether they impact the current client and other.
- Mark as New
- Bookmark
- Subscribe
- Mute
- Subscribe to RSS Feed
- Permalink
- Report Inappropriate Content
What I mean is that on the old view you could see all the ports and apps the client hs reached which is handy for policy setup. In the new view the applications are gone. They only show in your case when there is thousandeyes integration.
I don't want to lose the info like below.
- Mark as New
- Bookmark
- Subscribe
- Mute
- Subscribe to RSS Feed
- Permalink
- Report Inappropriate Content
Yep. It would be bad that a feature that has been in the dashboard for many years is being paywalled.
- Mark as New
- Bookmark
- Subscribe
- Mute
- Subscribe to RSS Feed
- Permalink
- Report Inappropriate Content
I have the integration set up (I believe), but it is showing nothing, do you have to wait after enabling the client 360 view?
- Mark as New
- Bookmark
- Subscribe
- Mute
- Subscribe to RSS Feed
- Permalink
- Report Inappropriate Content
The example you shared above (screenshot) shows a wireless device or client where everything seems to be working in good order or hasn't yet met any triggers, events, outages, etc within the last day timeline.
You can try going back further than 1 day or might try to find a troubled or problematic client device to see that all what events are being flagged
The documentation indicates a Vision for Improvement:
- Provide an at-a-glance view of the client's current state, including onboarding issues and root cause pathways.
- Onboarding issues are: Association, Authentication, DHCP and DNS problems.
- We also include Application performance from our existing ThousandEyes integration via the Active Application Monitoring feature.
- Consolidate key metrics (e.g., onboarding status, IP, application reachability, performance) into a clear, actionable format.
- Seamlessly integrate workflows (top-down and bottom-up) to maintain context across pages.
- Mark as New
- Bookmark
- Subscribe
- Mute
- Subscribe to RSS Feed
- Permalink
- Report Inappropriate Content
I’d like to share some feedback regarding the recent updates to the Client360 dashboard.
While I appreciate the enhanced visibility into client onboarding issues and the streamlined troubleshooting workflows, I’ve noticed several limitations that impact our day-to-day operations:
Loss of Application Visibility: The removal of built-in application and traffic insights—unless ThousandEyes is integrated—has reduced our ability to monitor client experience effectively. This functionality was previously available without additional licensing and was critical for policy setup and performance analysis.
Licensing Barrier: Requiring ThousandEyes for full application monitoring introduces a cost and setup barrier that may not be feasible for all organizations, especially those who relied on the legacy features.
Limited Historical Data: The one-week lookback window restricts our ability to perform long-term trend analysis and identify recurring issues.
Fragmented Context: Navigating between dashboard sections sometimes causes loss of context, making it harder to track client issues across different views.
We value the direction Meraki is taking with Client360 and hope future updates will restore some of the legacy functionality or offer more flexible integration options.
Thank you for your continued innovation and support.
-
Administrators
243 -
Change log
15 -
Firmware upgrades
32 -
Inventory
49 -
Licensing
82 -
Meraki mobile app
13 -
Other
180


