We're migrating to the Cisco Community on March 31. The Meraki Community will enter read-only mode starting on March 26 through March 31.
Learn more- Technical Forums
- :
- Switching
- :
- How to show uptime on meraki switch?
How to show uptime on meraki switch?
- Subscribe to RSS Feed
- Mark Topic as New
- Mark Topic as Read
- Float this Topic for Current User
- Bookmark
- Subscribe
- Mute
- Printer Friendly Page
- Mark as New
- Bookmark
- Subscribe
- Mute
- Subscribe to RSS Feed
- Permalink
- Report Inappropriate Content
How to show uptime on meraki switch?
Hello, how do I see the uptime on the Meraki switch. I am looking specifically for the following information: uptime and last reload reason.
- Mark as New
- Bookmark
- Subscribe
- Mute
- Subscribe to RSS Feed
- Permalink
- Report Inappropriate Content
Hi,
When you go to the switch you can view the Connectivity. This is the uptime.
The most common reason for a Meraki switch to go offline or reboot is either no connection to the internet or a firmware upgrade.
I've had no other events like a failed switch so not sure if that comes up in the event log.
Cheers,
Ben
- Mark as New
- Bookmark
- Subscribe
- Mute
- Subscribe to RSS Feed
- Permalink
- Report Inappropriate Content
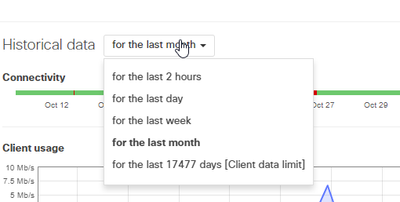
To piggy back on what @Ben is saying you can also select the device and check historical data from hour,day week, or month.
- Mark as New
- Bookmark
- Subscribe
- Mute
- Subscribe to RSS Feed
- Permalink
- Report Inappropriate Content
Indeed @kYutobi ! Forgot to mention that.
connectivity in the Switch overview:
And detail of the switch connectivity when you select one.
In both cases you can use the 2hours, last day, last week, ....
- Mark as New
- Bookmark
- Subscribe
- Mute
- Subscribe to RSS Feed
- Permalink
- Report Inappropriate Content
Thanks everyone, however, I am looking for the uptime and last reload, similar to show version on the cisco IOS. The switch can have power, but no IP connectivity to the cloud, etc. I am trying to determine if there was a loss of power to the device..in cisco IOS, you can do a show version and get that information.
- Mark as New
- Bookmark
- Subscribe
- Mute
- Subscribe to RSS Feed
- Permalink
- Report Inappropriate Content
Perhaps something might be logged to the event viewer.
- Mark as New
- Bookmark
- Subscribe
- Mute
- Subscribe to RSS Feed
- Permalink
- Report Inappropriate Content
Merkai support will be able to provide you information like when the device last rebooted/lost power and the reason behind why.
I'd also recommend using the make a wish feature within dashboard to submit a feature request if you believe that this feature should be available via the dashboard. My assumptions is that this is asked for a lot so I can imagine it'll only be time before it's included.
Found this helpful? Give me some Kudos! (click on the little up-arrow below)
- Mark as New
- Bookmark
- Subscribe
- Mute
- Subscribe to RSS Feed
- Permalink
- Report Inappropriate Content
Hi.
You are right. There are lots of limitations when working with Cisco Meraki devices. Basically, almost all the good stuff we are able to do with normal cisco devices like all the Show commands we cannot do it with Meraki.
We can send a wish message to see if they add those features on future updates.
- Mark as New
- Bookmark
- Subscribe
- Mute
- Subscribe to RSS Feed
- Permalink
- Report Inappropriate Content
The OP says that they cannot do the "good stuff" with Meraki switches that they could with "normal cisco switches". Well, Meraki leaves out most of the irrelevant stuff too, or is irrelevant for 80-90% of organizations.
Meraki was acquired by Cisco in 2013 as a complimentary product IMO, not a replacement for the legacy Cisco switches. Meraki was meant as a product that was simple to use and to administer from anywhere, for people who don't want to keep a network engineer on staff just to type in IOS commands. These switches are junior level administrator friendly. With these products I can trust a junior PC tech to change a VLAN on a port. If you just want to have a switch to where you can set up some VLANS, some basic L3 routing and VOIP phones, they are pretty good for that, and they perform well, in my case, much better than the switches that they replaced.
I would suggest that the OP didn't do his homework before buying these switches. They are not IOS switches nor were they intended to be. If you need IOS advanced features buy a Catalyst or Nexus switch, simple as that.
If you just need to know when the thing went down, go buy a log aggregator or SIEM and tell the Meraki platform to export syslog to it. That's what we do. You can get actionable information from the syslog output.
Or if you want to make it even simpler, use the new webhook feature. Disclaimer: I haven't personally tried this.
- Mark as New
- Bookmark
- Subscribe
- Mute
- Subscribe to RSS Feed
- Permalink
- Report Inappropriate Content
Sorry, but this is unacceptable.
Everyone wants to know the root cause for lack of connectivity. On smartphone when I loose connectivity when needed badly, I am very much interested if my gear is the problem or is it the network issue. If my home fiber connection went down, I want to know if that has to do something with power or is it an ISP problem.
When I administer thousands of Meraki sites, knowing if connection loss is power related is quite important.
This is a simple function to write, probably only change would be for the dashboard.
This thread does handles the matter more seriously:
https://community.meraki.com/t5/Security-SD-WAN/Uptime-command-in-Meraki/td-p/49260
- Mark as New
- Bookmark
- Subscribe
- Mute
- Subscribe to RSS Feed
- Permalink
- Report Inappropriate Content
Viewing the uptime is a very simple feature that absolutely should be included in the Dashboard. The problem with some of your arguments about Meraki is that many of the Meraki SE's & sales folks that I've encountered position this as a legit enterprise-class product. You can't have it both ways. Either it is "Enterprise Class" or its not. Obviously it's the latter.
- Mark as New
- Bookmark
- Subscribe
- Mute
- Subscribe to RSS Feed
- Permalink
- Report Inappropriate Content
Clayton,
That is my opinion also. I understand the argument that Meraki is not intended to be a replacement for IOS/NXOS/NGFW etc, but they are often marketed that way. I do think that Meraki makes a great solution for some situations, but they are in no way shape or form Enterprise class hardware in my opinion.
- Mark as New
- Bookmark
- Subscribe
- Mute
- Subscribe to RSS Feed
- Permalink
- Report Inappropriate Content
We're not asking for 80-90% functionality, a simple uptime counter, something every major OS has would be ideal. dO yOuR rEsEaRcH!
- Mark as New
- Bookmark
- Subscribe
- Mute
- Subscribe to RSS Feed
- Permalink
- Report Inappropriate Content
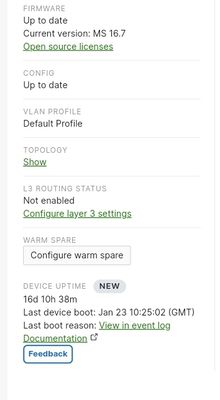
@popanonymous there is an uptime counter now. Check the dashboard, it is down at the bottom on the switch page:
- Mark as New
- Bookmark
- Subscribe
- Mute
- Subscribe to RSS Feed
- Permalink
- Report Inappropriate Content
Im also still waiting for this feature to show up in our dashboard. I was told by an engineer they have been slowly pushing out this update since Oct. of 2023.
- Mark as New
- Bookmark
- Subscribe
- Mute
- Subscribe to RSS Feed
- Permalink
- Report Inappropriate Content
No Uptime in our MSP dashboard. And we have a situation past few days for a client that is going offline every 2 hours. Would be nice to confirm if it is indeed infrastructure power or ISP related.
- Mark as New
- Bookmark
- Subscribe
- Mute
- Subscribe to RSS Feed
- Permalink
- Report Inappropriate Content
Ben-
How did you get the option for "for the last 17477 days[client data limit]"? We are currently using the API to pull data into a BI solution for review of status and calculating up time which allows for long queries but it would be helpful to have such an option directly in Dashboard.


