Get answers from our community of experts in record time.
Join now- Technical Forums
- :
- Security & SD-WAN
- :
- RTT Latency and Jitter report in MX Summary
RTT Latency and Jitter report in MX Summary
Solved- Subscribe to RSS Feed
- Mark Topic as New
- Mark Topic as Read
- Float this Topic for Current User
- Bookmark
- Subscribe
- Mute
- Printer Friendly Page
- Mark as New
- Bookmark
- Subscribe
- Mute
- Subscribe to RSS Feed
- Permalink
- Report Inappropriate Content
RTT Latency and Jitter report in MX Summary
How does MX report its RTT Latency and Jitter report in MX Summary (Organization > Summary Report)
Does MX measures RTT, Latency based on real traffic which goes through each WAN ?
or it measures against the IP destination that we configure in SD-WAN & Traffic shaping > Uplink statistics ?
Thanks, Sakul

Solved! Go to solution.
- Mark as New
- Bookmark
- Subscribe
- Mute
- Subscribe to RSS Feed
- Permalink
- Report Inappropriate Content
As per the following doc, it measures against the default uplink statistic under SD-WAN & Traffic shaping > Uplink statistics
https://documentation.meraki.com/General_Administration/Cross-Platform_Content/Summary_Report_Overvi...
- Mark as New
- Bookmark
- Subscribe
- Mute
- Subscribe to RSS Feed
- Permalink
- Report Inappropriate Content
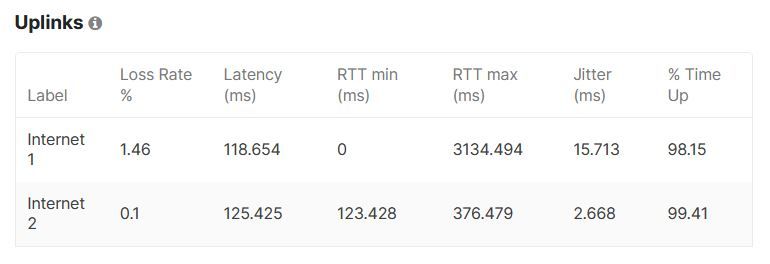
Thanks Brash. SD-WAN & Traffic shaping > Uplink statistics , I changed from default which was 8.8.8.8 to a SAP cloud application (I am in Thailand and SAP app is in Sydney), and the Uplink statistic now shows that my Internet1 has a lot of hiccups reaching SAP app.
- Mark as New
- Bookmark
- Subscribe
- Mute
- Subscribe to RSS Feed
- Permalink
- Report Inappropriate Content
by the way, I found this one of good ways to check network performance to a certain application.
-
3rd Party VPN
165 -
ACLs
90 -
Auto VPN
290 -
AWS
36 -
Azure
66 -
Client VPN
368 -
Firewall
835 -
iOS
1 -
Other
540 -
Wireless LAN MR
1

