Turn on suggestions
Auto-suggest helps you quickly narrow down your search results by suggesting possible matches as you type.
- Technical Forums
- :
- Security & SD-WAN
- :
- Re: MX68W Dashbord doesn't have an icon to view application details
MX68W Dashbord doesn't have an icon to view application details
SolvedOptions
- Subscribe to RSS Feed
- Mark Topic as New
- Mark Topic as Read
- Float this Topic for Current User
- Bookmark
- Subscribe
- Mute
- Printer Friendly Page
May 25 2023
11:10 PM
- Mark as New
- Bookmark
- Subscribe
- Mute
- Subscribe to RSS Feed
- Permalink
- Report Inappropriate Content
May 25 2023
11:10 PM
MX68W Dashbord doesn't have an icon to view application details
Hi Everyone,
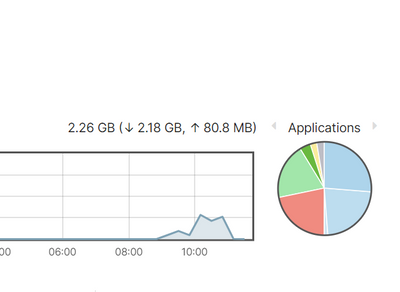
I want to analyze about the client/IP application details in MX68W.
But Dashbord doesn't have an icon to view details. Is there a solution?
Picture in below
Thanks
Aren
Solved! Go to solution.
1 Accepted Solution
May 26 2023
2:46 AM
- Mark as New
- Bookmark
- Subscribe
- Mute
- Subscribe to RSS Feed
- Permalink
- Report Inappropriate Content
May 26 2023
2:46 AM
Likely because you've only just enabled it. It will need time to build up.
6 Replies 6
May 26 2023
2:04 AM
- Mark as New
- Bookmark
- Subscribe
- Mute
- Subscribe to RSS Feed
- Permalink
- Report Inappropriate Content
May 26 2023
2:04 AM
Do you have detailed analytics turned on for that network?
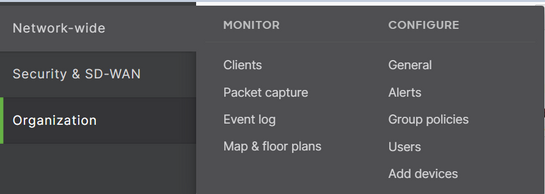
Check under -> Newtwork wide -> settings
May 26 2023
2:20 AM
- Mark as New
- Bookmark
- Subscribe
- Mute
- Subscribe to RSS Feed
- Permalink
- Report Inappropriate Content
May 26 2023
2:20 AM
My dashboard doesn't have a settings icon.
May 26 2023
2:21 AM
- Mark as New
- Bookmark
- Subscribe
- Mute
- Subscribe to RSS Feed
- Permalink
- Report Inappropriate Content
May 26 2023
2:21 AM
Sorry, it should be under Network Wide -> General
May 26 2023
2:45 AM
- Mark as New
- Bookmark
- Subscribe
- Mute
- Subscribe to RSS Feed
- Permalink
- Report Inappropriate Content
May 26 2023
2:45 AM
OK, I've seen the icon details. But it shows that the data is insufficient 😢.
May 26 2023
2:46 AM
- Mark as New
- Bookmark
- Subscribe
- Mute
- Subscribe to RSS Feed
- Permalink
- Report Inappropriate Content
May 26 2023
2:46 AM
Likely because you've only just enabled it. It will need time to build up.
May 26 2023
3:09 AM
- Mark as New
- Bookmark
- Subscribe
- Mute
- Subscribe to RSS Feed
- Permalink
- Report Inappropriate Content
May 26 2023
3:09 AM
Thank you very much, I have another question, can Meraki mx68w view traffic flow like a firewall, e.g. when did you access this site or what sites are you blocked?
Get notified when there are additional replies to this discussion.
© 2025 Cisco Systems, Inc.


