We're migrating to the Cisco Community on March 29. The Meraki Community will enter read-only mode starting on March 26.
Learn more- Technical Forums
- :
- Developers & APIs
- :
- Re: Not happy with the Dashboard status map - build your own.
Not happy with the Dashboard status map - build your own.
- Subscribe to RSS Feed
- Mark Topic as New
- Mark Topic as Read
- Float this Topic for Current User
- Bookmark
- Subscribe
- Mute
- Printer Friendly Page
- Mark as New
- Bookmark
- Subscribe
- Mute
- Subscribe to RSS Feed
- Permalink
- Report Inappropriate Content
Not happy with the Dashboard status map - build your own.
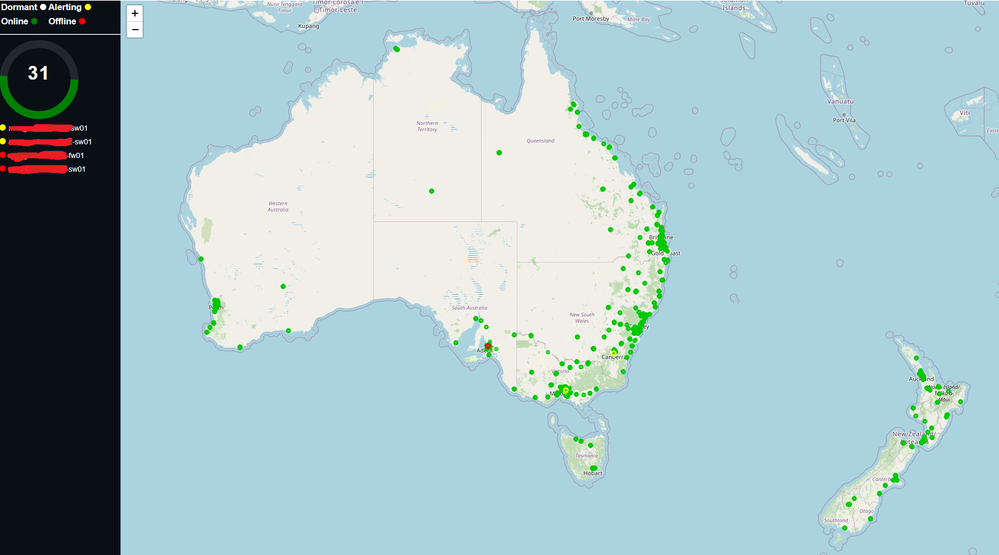
Using python and flask running on an Ubuntu server I've managed to develop a map that's more useful to our customers.
Basic concept is.
1. Using python grab the ORGs device statuses
2. Publish the results to a JSON file
3. Flask used to generate the webpage and some scripting used in the webpage read the JSON and display the results and refresh every 1 minute. The makers are animated so it makes the map a bit more interesting. I use flask to remove any devices I'm not interested in or alarms that are irrelevant.
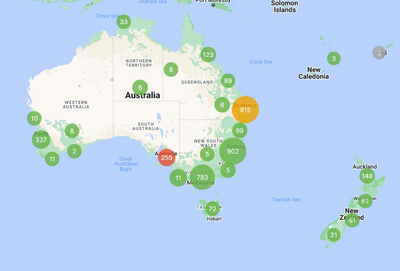
Goodbye old map
- Mark as New
- Bookmark
- Subscribe
- Mute
- Subscribe to RSS Feed
- Permalink
- Report Inappropriate Content
That looks great. This is something I would love to do but lacking the skill to do it. Would you mind sharing the code for this?
Thanks
- Mark as New
- Bookmark
- Subscribe
- Mute
- Subscribe to RSS Feed
- Permalink
- Report Inappropriate Content
Here's a quick overview and most of the code I have stripped out that is relevant. It was a big learning curve so my code might be poorly written. When I have time I'll make it better.
My actual setup is an AWS server using Docker containers. I have the following containers running.
Flask - Publishing the web pages
Grafana - Displaying historical data for all Meraki devices and other network devices.
InflxDb - Storing the data for above
Python3 - For my main code
Busybox - Used for sharing data between containers
=========================================================================
Flask code. The URL for the map will be http://<your server>/map
getOrganizationDeviceStatuses_with_location.json is from your python code generated from script 2
You'll need a sample index.html for your home or remove the route to it.
I've stripped out loads of code as I do a lot more than just maps. I do health reporting too but that would be too hard to explain how it all hangs together. One day I might write a doco.
There's probably imports not needed for a simple map in the python code but you'll have to work some stuff out. You'll need to setup directory structures and have an understanding of python and html etc to get it working but it'll give you an idea on how it works.
=========================================================================
from flask import Flask, render_template, request, jsonify, send_file, send_from_directory
import json
import os
import datetime
import pytz
import csv
app = Flask(__name__)
@app.route('/')
def home():
return render_template('index.html')
@app.route('/map')
def map_page():
data_url = "http://<your server>/shared_data/getOrganizationDeviceStatuses_with_location.json"
return render_template('map.html', data_url=data_url)
Python code - 2 scripts I use as I do other stuff with the first API results. can be combined into one script. i collect data every 5 minutes in a loop.
JSON_store is the place I store the JSON data in the busybox container
==============
SCRIPT 1 - This part grabs the devices from the ORG and the Device statuses and writes to a JSON store
==============
response = dashboard.organizations.getOrganizationDevices(org_id, total_pages='all')
with open(JSON_store + "getOrganizationDevices.json", "w") as f:
json.dump(response, f)
response = dashboard.organizations.getOrganizationDevicesStatuses(org_id, total_pages='all')
with open(JSON_store + "getOrganizationDevicesStatuses.json", "w") as f:
json.dump(response, f)
===========
SCRIPT 2
===========
import json
# Read the first JSON file
with open('json_files/getOrganizationDevices.json', 'r') as file:
devices = json.load(file)
# Read the second JSON file
with open('json_files/getOrganizationDevicesStatuses.json', 'r') as file:
statuses = json.load(file)
# Create a dictionary to store the device status with location
devices_with_location = {}
# Iterate over the devices
for device in devices:
name = device['name']
if 'nomad' in name.lower() or 'lab' in name.lower():
continue # Skip this device if it contains "nomad" or "lab" in the name # <<< Filtering out unwanted networks
lat = device['lat']
lng = device['lng']
# Find the corresponding status for the device
for status in statuses:
if status['name'] == name:
device_status = status['status']
break
else:
device_status = None
# Store the device status with location
devices_with_location[name] = {
'lat': lat,
'lng': lng,
'status': device_status
}
print("Write getOrganizationDeviceStatuses_with_location.json")
# Write the result to a new JSON file
with open('json_files/getOrganizationDeviceStatuses_with_location.json', 'w') as file: # <<<<<< This is the final JSON the webpage calls
json.dump(devices_with_location, file)
===========
Webpage to display the map - It's a bit messy and needs tidying up as it's my first draft but does the job for now. Sometimes Meraki comes back with a device status of 'null' which is strange and I need to work on hadling that better
===========
<!DOCTYPE html>
<html>
<head>
<title>Full Screen Map</title>
<style>
html, body {
margin: 0;
padding: 0;
height: 100%;
}
#map {
position: absolute;
top: 0;
left: 12%; /* Adjusted the left position to accommodate the marker names */
width: 88%;
height: 100%;
}
#marker-names {
position: absolute;
top: 0;
left: 0;
width: 20%;
height: 100%;
background-color: rgb(10, 15, 22);
color: white;
overflow-y: auto;
}
#marker-names p {
margin: 0;
padding: 5px 0;
}
#problem-devices {
font-weight: bold;
margin-bottom: 10px;
}
.circle {
display: inline-block;
width: 12px;
height: 12px;
border-radius: 50%;
margin-right: 5px;
}
#refresh-timer {
position: absolute;
top: 50%;
left: 50%;
transform: translate(-50%, -50%);
color: white;
font-family: "Roboto", sans-serif;
font-size: 50px;
}
#timer-svg {
width: 150px;
height: 150px;
}
#timer-text {
font-size: 48px;
fill: white;
text-anchor: middle;
font-family: "Roboto", sans-serif;
font-weight: bold;
letter-spacing: 2px;
}
</style>
<link rel="stylesheet" href="https://cdnjs.cloudflare.com/ajax/libs/leaflet/1.7.1/leaflet.css" />
</head>
<body>
<div id="map"></div>
<div id="marker-names">
<div id="problem-devices" style="font-size: 20px;">Refreshing data...</div>
<svg id="timer-svg" viewBox="0 0 200 200" xmlns="http://www.w3.org/2000/svg">
<circle id="timer-bg" cx="100" cy="100" r="90" fill="none" stroke="rgba(255, 255, 255, 0.1)" stroke-width="20" />
<circle id="timer-progress" cx="100" cy="100" r="90" fill="none" stroke="green" stroke-width="20" stroke-dasharray="565.48" stroke-dashoffset="0" />
<text id="timer-text" x="100" y="100">60</text>
</svg>
</div>
<script src="https://cdnjs.cloudflare.com/ajax/libs/leaflet/1.7.1/leaflet.js"></script>
<script>
var map = L.map('map').setView([-30.5, 145], 5);
L.tileLayer('https://{s}.tile.openstreetmap.org/{z}/{x}/{y}.png', {}).addTo(map);
map.on('zoomend', function() {
if (map.getZoom() === 4) {
map.setZoom(4.5);
}
});
function refreshPage() {
location.reload();
}
function startRefreshTimer() {
var count = 60; // Refresh countdown in seconds
var startTime = null;
var frameRate = 5; // Desired frame rate (5 frames per second)
var timerText = document.getElementById('timer-text');
var timerProgress = document.getElementById('timer-progress');
function animateTimer(timestamp) {
if (!startTime) startTime = timestamp;
var elapsedTime = timestamp - startTime;
count = Math.max(60 - Math.floor(elapsedTime / 1000), 0);
timerText.textContent = count;
// Update the progress circle
var circumference = 2 * Math.PI * 90;
var dashOffset = circumference - (count / 60) * circumference;
timerProgress.style.strokeDashoffset = dashOffset;
if (count > 0) {
var timePerFrame = 1000 / frameRate;
var timeSinceLastFrame = elapsedTime % timePerFrame;
if (timeSinceLastFrame >= timePerFrame - 1 || timeSinceLastFrame === 0) {
requestAnimationFrame(animateTimer);
} else {
setTimeout(function() {
requestAnimationFrame(animateTimer);
}, timePerFrame - timeSinceLastFrame);
}
} else {
timerText.textContent = '0';
refreshPage();
}
}
requestAnimationFrame(animateTimer);
}
fetch('http://<server IP>/shared_data/getOrganizationDeviceStatuses_with_location.json') # Your server IP
.then(response => response.json())
.then(data => {
var redMarkers = [];
var offlineMarkerNames = [];
var alertingMarkerNames = [];
Object.entries(data).forEach(([key, value]) => {
if (value.status === 'null') {
return; // Ignore when status is 'null'
}
var markerColor;
var markerRadius = 3;
if (value.status === 'online') {
markerColor = 'rgb(0, 200, 0)'; // Slightly brighter green color
} else if (value.status === 'alerting') {
markerColor = 'yellow';
markerRadius *= 2.5;
alertingMarkerNames.push(key); // Add to alerting marker names
} else if (value.status === 'dormant') {
markerColor = 'white';
markerRadius *= 2;
} else {
markerColor = 'red';
markerRadius *= 2.5;
offlineMarkerNames.push(key); // Add to offline marker names
}
if (value.status !== 'null') {
var marker = L.circleMarker([value.lat, value.lng], { radius: markerRadius, color: markerColor });
marker.bindPopup(`<b>${key}</b><br>Status: ${value.status}`);
map.addLayer(marker);
if (markerColor === 'red' || markerColor === 'yellow') {
redMarkers.push(marker);
}
}
});
redMarkers.forEach(marker => {
marker.bringToFront();
});
var flashingMarkers = redMarkers.filter(marker => marker.options.color === 'yellow' || marker.options.color === 'red');
var pulseInterval = setInterval(function() {
flashingMarkers.forEach(marker => {
var radius = marker.options.radius;
var targetRadius1, targetRadius2, targetRadius3, targetRadius4;
if (marker.options.color === 'yellow') {
targetRadius1 = radius * 1; // Increase the radius by 5% for yellow markers
targetRadius2 = radius * 0.1; // Increase the radius by 10% for yellow markers
targetRadius3 = radius * 0.25; // Increase the radius by 15% for yellow markers
targetRadius4 = radius * 0.5; // Reduce the radius by 10% for yellow markers
} else {
targetRadius1 = radius * 1; // Increase the radius by 5% for red markers
targetRadius2 = radius * 0.1; // Increase the radius by 10% for red markers
targetRadius3 = radius * 0.25; // Increase the radius by 15% for red markers
targetRadius4 = radius * 0.5; // Reduce the radius by 10% for red markers
}
marker.setStyle({ radius: targetRadius1 });
setTimeout(function() {
marker.setStyle({ radius: targetRadius2 });
setTimeout(function() {
marker.setStyle({ radius: targetRadius3 });
setTimeout(function() {
marker.setStyle({ radius: targetRadius4 });
setTimeout(function() {
marker.setStyle({ radius: radius }); // Reset the radius to its original value
}, 200); // Wait for 400 milliseconds before resetting the radius
}, 200); // Wait for 400 milliseconds before reducing the radius
}, 200); // Wait for 400 milliseconds before increasing the radius
}, 250); // Wait for 500 milliseconds before increasing the radius
});
}, 1000); // Repeat the pulse animation every 2000 milliseconds (2 seconds)
var markerNamesElement = document.getElementById('marker-names');
var offlineNamesHTML = offlineMarkerNames.map(name => `<p style="color: white; font-family: 'Arial', sans-serif; font-size: 14px;"><span class="circle" style="background-color: red;"></span>${name}</p>`).join('');
var alertingNamesHTML = alertingMarkerNames.map(name => `<p style="color: white; font-family: 'Arial', sans-serif; font-size: 14px;"><span class="circle" style="background-color: yellow;"></span>${name}</p>`).join('');
var problemDevicesElement = document.getElementById('problem-devices');
problemDevicesElement.innerHTML = "<table style='font-family: Roboto, sans-serif;'>" +
"<tr><td><span style='font-size: smaller; color: white;'>Dormant</span> <span style='display: inline-block; width: 12px; height: 12px; background-color: white; border-radius: 50%;'></span></td><td><span style='font-size: smaller; color: white;'>Alerting</span> <span style='display: inline-block; width: 12px; height: 12px; background-color: yellow; border-radius: 50%;'></span></td></tr>" +
"<tr><td><span style='font-size: smaller; color: white;'>Online</span> <span style='display: inline-block; width: 12px; height: 12px; background-color: green; border-radius: 50%;'></span></td><td><span style='font-size: smaller; color: white;'>Offline</span> <span style='display: inline-block; width: 12px; height: 12px; background-color: red; border-radius: 50%;'></span></td></tr>" +
"</table>" +
"<hr>";
markerNamesElement.innerHTML += alertingNamesHTML;
markerNamesElement.innerHTML += offlineNamesHTML;
// Start the refresh timer
startRefreshTimer();
})
.catch(error => console.error('Error:', error));
</script>
</body>
</html>
- Mark as New
- Bookmark
- Subscribe
- Mute
- Subscribe to RSS Feed
- Permalink
- Report Inappropriate Content
Thank you. That should get me started!
- Mark as New
- Bookmark
- Subscribe
- Mute
- Subscribe to RSS Feed
- Permalink
- Report Inappropriate Content
Secret hint. ChatGPT will be a big help. It was invaluable to getting much of the complicated stuff working. Just don't tell anyone.:-)
- Mark as New
- Bookmark
- Subscribe
- Mute
- Subscribe to RSS Feed
- Permalink
- Report Inappropriate Content
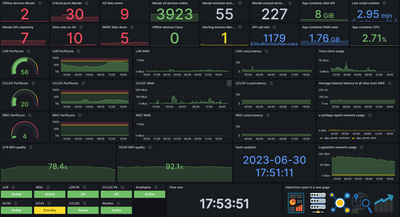
Here's my Grafana that's gives me detailed reporting. I've got a few more dashboards but it shows what can be done with a bit of time. It quickly becomes an addiction. Just gotta keep the API calls under the enforced limits.
- Mark as New
- Bookmark
- Subscribe
- Mute
- Subscribe to RSS Feed
- Permalink
- Report Inappropriate Content
That is a lovely visualization! I like the Grafana dashboard as well 🙂
- Mark as New
- Bookmark
- Subscribe
- Mute
- Subscribe to RSS Feed
- Permalink
- Report Inappropriate Content
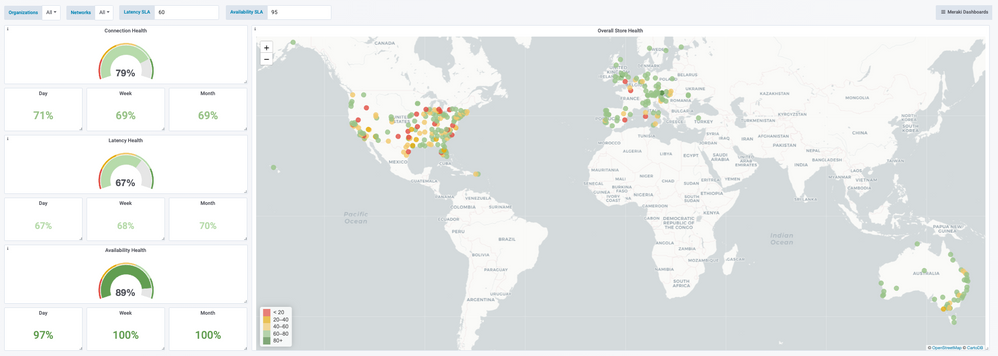
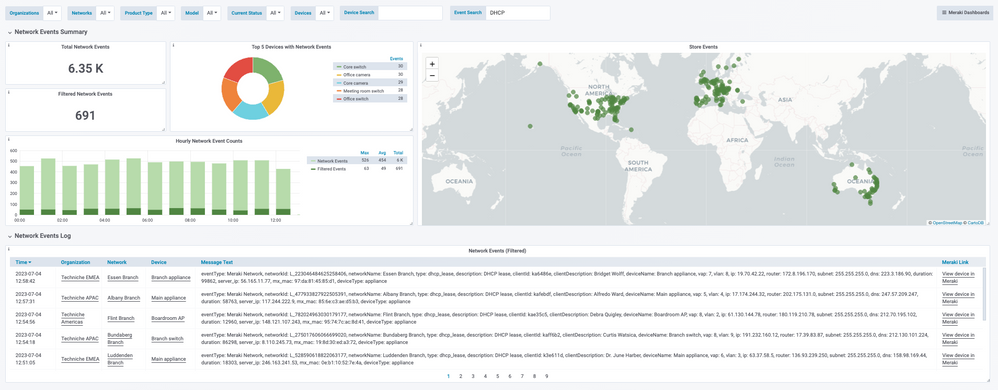
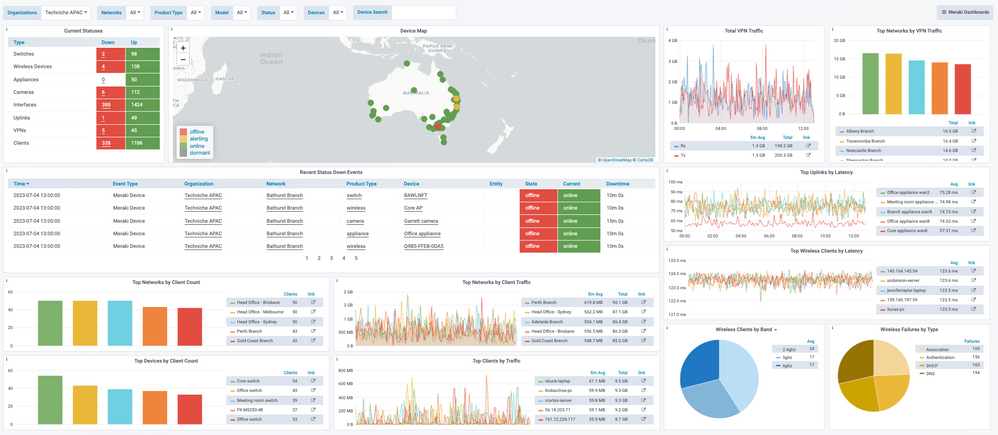
Here are some dashboards we have created
- Mark as New
- Bookmark
- Subscribe
- Mute
- Subscribe to RSS Feed
- Permalink
- Report Inappropriate Content
What the backed?
- Mark as New
- Bookmark
- Subscribe
- Mute
- Subscribe to RSS Feed
- Permalink
- Report Inappropriate Content
Not sure I understand the question, are you asking what is used to store the data and present the dashboards?
- Mark as New
- Bookmark
- Subscribe
- Mute
- Subscribe to RSS Feed
- Permalink
- Report Inappropriate Content
Yes thats my exact question!
- Mark as New
- Bookmark
- Subscribe
- Mute
- Subscribe to RSS Feed
- Permalink
- Report Inappropriate Content
it's a inhouse time series database, built for fast ingestion and long term storage and the front end is a inhouse flexible dashboarding framework.
- Mark as New
- Bookmark
- Subscribe
- Mute
- Subscribe to RSS Feed
- Permalink
- Report Inappropriate Content
Nice to see what others are doing. I like the network events charts. I think I'll be adding that to get a feel for what's going on globally.
-
Bluetooth
3 -
Captive Portal API
11 -
Code Sample
63 -
Dashboard API
376 -
Getting Started
10 -
Other
6 -
Python
13 -
Scanning API
28 -
Updates from Meraki
50 -
Webhooks
19 -
Webinars
6
