We're migrating to the Cisco Community on March 29. The Meraki Community will enter read-only mode starting on March 26.
Learn more- Technical Forums
- :
- Developers & APIs
- :
- Capture Alert on Dashboard for Meraki Fan Failure on MX Device
Capture Alert on Dashboard for Meraki Fan Failure on MX Device
- Subscribe to RSS Feed
- Mark Topic as New
- Mark Topic as Read
- Float this Topic for Current User
- Bookmark
- Subscribe
- Mute
- Printer Friendly Page
- Mark as New
- Bookmark
- Subscribe
- Mute
- Subscribe to RSS Feed
- Permalink
- Report Inappropriate Content
Capture Alert on Dashboard for Meraki Fan Failure on MX Device
Hello all,
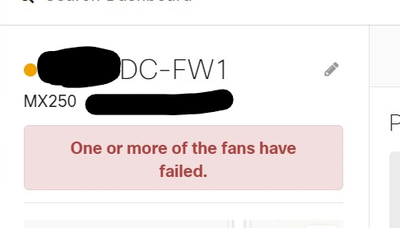
I'm looking for an API to capture the following alert of MX250 device.
The alert is visible on the Network-> Security & SD-Wan -> Appliance Status page.
I have checked the network event logs, but I am not able to locate anything for this and there are no webhooks to trigger an alert for this either!
Would anyone happen to know how we can capture this alert?
Thanks,
Craig.
- Labels:
-
Dashboard API
-
Webhooks
- Mark as New
- Bookmark
- Subscribe
- Mute
- Subscribe to RSS Feed
- Permalink
- Report Inappropriate Content
I can't see anyway to capture this one.
- Mark as New
- Bookmark
- Subscribe
- Mute
- Subscribe to RSS Feed
- Permalink
- Report Inappropriate Content
Maybe you can get this information via snmp. Either via cloud or directly on the device.
I didn't check it, as I don't have a failed fan here, but it might be worth a try
- Mark as New
- Bookmark
- Subscribe
- Mute
- Subscribe to RSS Feed
- Permalink
- Report Inappropriate Content
@Greenberet @PhilipDAth
Hey guys, thanks for the suggestions and information.
I have tested out SNMP, sadly that information does not get collected from it.
Will have to wait until they release a webhook or an API to check for such alerts.
Cheers,
Craig.
- Mark as New
- Bookmark
- Subscribe
- Mute
- Subscribe to RSS Feed
- Permalink
- Report Inappropriate Content
Is this kind of error in the event log of the dashboard?
- Mark as New
- Bookmark
- Subscribe
- Mute
- Subscribe to RSS Feed
- Permalink
- Report Inappropriate Content
Hey @Greenberet ,
I checked the event logs for a month back from time I noticed the alert in the dashboard, there were no logs present for this.
Seems to be that the event log in the Dashboard only captures the software related alerts, don't see any filters or any logs for any Hardware faults in it. ( Do correct me if im wrong)
Hope this helps in any way.
To the Meraki devs, please get us an API to view such alerts! 🙂
Thanks,
Craig.
-
Bluetooth
3 -
Captive Portal API
11 -
Code Sample
63 -
Dashboard API
376 -
Getting Started
10 -
Other
6 -
Python
13 -
Scanning API
28 -
Updates from Meraki
50 -
Webhooks
19 -
Webinars
6

