Get answers from our community of experts in record time.
Join now- Technical Forums
- :
- Dashboard & Administration
- :
- Recommendations for Extended Data Storage Monitoring Tool SNMP vs API
Recommendations for Extended Data Storage Monitoring Tool SNMP vs API
- Subscribe to RSS Feed
- Mark Topic as New
- Mark Topic as Read
- Float this Topic for Current User
- Bookmark
- Subscribe
- Mute
- Printer Friendly Page
- Mark as New
- Bookmark
- Subscribe
- Mute
- Subscribe to RSS Feed
- Permalink
- Report Inappropriate Content
Recommendations for Extended Data Storage Monitoring Tool SNMP vs API
I'm looking for a monitoring tool that can help me store performance data for longer periods of time with higher resolution.
I'm currently using the Mearki dashboard, but I find that its data storage period and resolution are somewhat limited for my needs. To address this, I've been exploring other monitoring solutions to find one that allows me to store data for longer periods and with higher resolution. As part of my search, I've already tried Zabbix and Checkmk, but I'm curious to know if there's any other monitoring tool that you love and found relatively easy to set up.
I've recently set up a virtual machine in Azure with decent specs (8 cores, 16GB RAM, 64GB storage). This VM can connect to all the management subnets in my networks across the globe. Currently, I've successfully configured SNMP v3 device discoveries and utilized the tools' API endpoints to some extent, though with varying degrees of success.
Specifically, I'm having trouble with the API endpoints for CheckMK and Zabbix. I've followed the documentation, but I'm still not able to get them to work properly. Has anyone else had success deploying with a tool like that?
- Mark as New
- Bookmark
- Subscribe
- Mute
- Subscribe to RSS Feed
- Permalink
- Report Inappropriate Content
I'm interested in this topic as well.
I recently started to play with Zabbix as well. You might be intstrested to know Zabbix has a built in template that can query Meraki via API https://www.zabbix.com/integrations/meraki I've not mananaged to make it work as yet.
It would be great if we can have longer term packet loss data and higher resolution. I find the built in graphs lacking as well.
- Mark as New
- Bookmark
- Subscribe
- Mute
- Subscribe to RSS Feed
- Permalink
- Report Inappropriate Content
I can totally relate to your struggle with the Zabbix API integration. I tied to get it working and was unable, and the documentation doesn't always provide the clearest instructions. I remember encountering the "uplink not found" error.
Checkmk's also has a Meraki API integration, but iv encountering problems with it too but they say its a new thing and there working on it. Sometimes, these integrations can be a bit challenging until they mature.
SNMP v3 polling across the tunnels is what im working on now. However,it might be causing some strain on the CPU load.
- Mark as New
- Bookmark
- Subscribe
- Mute
- Subscribe to RSS Feed
- Permalink
- Report Inappropriate Content
- Mark as New
- Bookmark
- Subscribe
- Mute
- Subscribe to RSS Feed
- Permalink
- Report Inappropriate Content
Iv seen logicMonitor but never dove in to it but yeah this looks like its Covers my requirements. Do you know how it integrates with Meraki Is it via the api Or is it snmp?
- Mark as New
- Bookmark
- Subscribe
- Mute
- Subscribe to RSS Feed
- Permalink
- Report Inappropriate Content
looks like its api
- Mark as New
- Bookmark
- Subscribe
- Mute
- Subscribe to RSS Feed
- Permalink
- Report Inappropriate Content
We (I'm a PM at LogicMonitor) use a combination of data collection from the Dashboard API, snmp.meraki.com, and syslog. Some data is not easily accessible or too costly (against the Dashboard API rate limit) to get via API, so we interweave data from snmp.meraki.com where necessary (i.e. where we might have to make per-device API calls against thousands to tens-of thousands of devices).
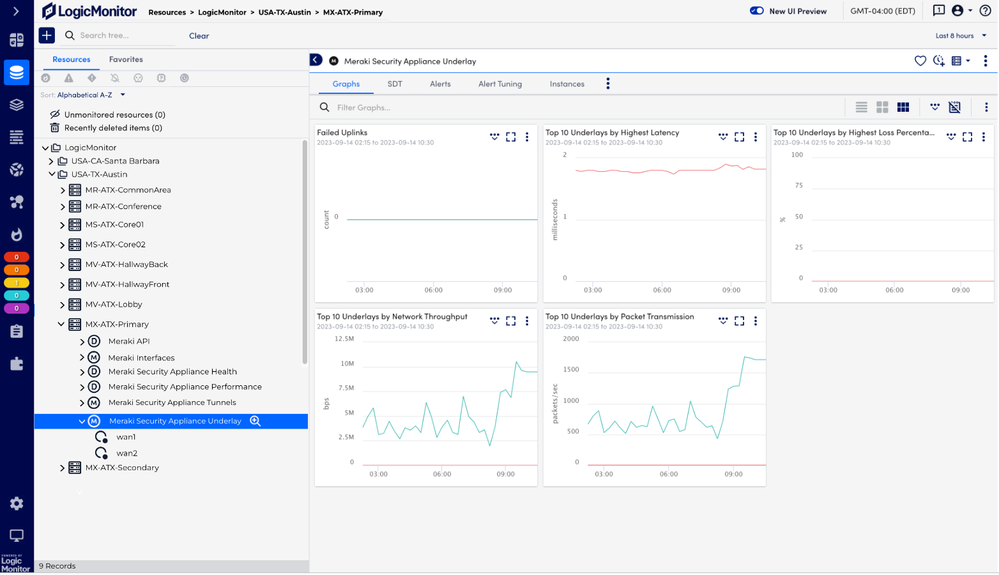
Example. For Meraki MX we get the performance score from the Dashboard API and get the Client Count from snmp.meraki.com. Similarly, for uplinks (shown below), we get the send/receive data from snmp.meraki.com, but get the status, loss, and latency stats from the API. However, for other areas like VPN tunnels or MR Radio stats we get everything from the API. The persons using LogicMonitor are generally unaware of this unless they are the one who did the original configuration.
- Mark as New
- Bookmark
- Subscribe
- Mute
- Subscribe to RSS Feed
- Permalink
- Report Inappropriate Content
For information on options of available monitoring vendors, you can look in the Meraki Marketplace, as LogicMonitor is not your only option.
https://apps.meraki.io/en-US/listing?q=monitoring
- Mark as New
- Bookmark
- Subscribe
- Mute
- Subscribe to RSS Feed
- Permalink
- Report Inappropriate Content
To set up Prometheus and Grafana:
- Deploy Prometheus on your VM.
- Configure Prometheus to scrape metrics from your targets.
- Set up Grafana and connect it to Prometheus for lead data enrichment.
- Design dashboards in Grafana to visualize the collected metrics.
Regarding your issues with API endpoints in CheckMK and Zabbix, troubleshooting these problems can involve various factors. Ensure that you've followed the documentation carefully and have the necessary permissions. Also, check for any firewall issues or misconfigurations.
As for community experiences, it's a good idea to explore forums, user groups, or GitHub repositories dedicated to these tools. Often, you can find solutions to common problems or get assistance from experienced users. Keep in mind that these tools might have updates or changes, so staying connected with the community can be valuable.
-
Administrators
237 -
Change log
14 -
Firmware upgrades
31 -
Inventory
48 -
Licensing
78 -
Meraki mobile app
12 -
Other
174

