- Technical Forums
- :
- Developers & APIs
- :
- About Network usage
About Network usage
Solved- Subscribe to RSS Feed
- Mark Topic as New
- Mark Topic as Read
- Float this Topic for Current User
- Bookmark
- Subscribe
- Mute
- Printer Friendly Page
- Mark as New
- Bookmark
- Subscribe
- Mute
- Subscribe to RSS Feed
- Permalink
- Report Inappropriate Content
About Network usage
I have been collecting data usage using Meraki Dashboard API for a month.
But the usage I collected is too different from Meraki Dashboard.
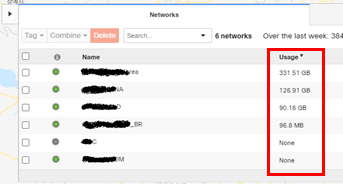
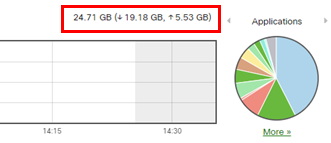
Which API should I use to get the usage on the two screens below?
1) View all networks
2) Network-wide → Clients
The APIs I currently use are 'Get_Network_traffic' and 'Get_Network_Client'.
If you can help me, please reply.
Solved! Go to solution.
- Labels:
-
Dashboard API
- Mark as New
- Bookmark
- Subscribe
- Mute
- Subscribe to RSS Feed
- Permalink
- Report Inappropriate Content
Based on what I see on some of our demo networks, the network usage figure on the Organization->Overview is the sum of all traffic over seven days, probably a cached value rather than real time, i.e. updated on some schedule, not when the page is redrawn.
You could use https://developer.cisco.com/meraki/api-v1/#!get-network-traffic with timespan set to 604800 then simply sum the sent and recv for each application.
Note that this call requires traffic analysis with hostname visibility to be enabled on the network(s) you want to get data for.
I just tested it on one of our lab networks...
Sum of API data 48,986,330 KB
Figure in overview 46.84 GB, it's lower, but if it is a cached value that would be expected.
Btw my experience is that trying to externally match figures displayed by orchestrator screens (not only Meraki) is often futile...
i) The orchestrator is unlikely to be using the external API, nor the basis of internal calculations publicly documented.
ii) The orchestrator may not be showing the correct numbers anyway! There's a non-Cisco orchestrator that has been misreporting traffic for years, by huge amounts, both in its user interface and in what is accessed via API, it took a while before the vendor accepted our evidence, even longer to find the cause and fix it.
- Mark as New
- Bookmark
- Subscribe
- Mute
- Subscribe to RSS Feed
- Permalink
- Report Inappropriate Content
Thank you for your answer.
Then, should I understand that I can't get exactly the same value as Meraki Dashboard using API?
- Mark as New
- Bookmark
- Subscribe
- Mute
- Subscribe to RSS Feed
- Permalink
- Report Inappropriate Content
Well, you could get the same value, but to do that you would need to take your sample at the same time(s) that the Overview figures are calculated, I'd guess this is done daily.
But unless you happen to take a sample at the same time, the API will always get a result that is equal or greater than shown in Overview due to usage since the daily sample.
This assumes all my guesses about how it works are close enough 😊
-
Bluetooth
17 -
Captive Portal API
47 -
Code Sample
148 -
Dashboard API
842 -
Getting Started
12 -
MQTT
3 -
MV Sense
10 -
Other
9 -
Python
15 -
Scanning API
96 -
Updates from Meraki
101 -
Webhooks
45 -
Webinars
10


